Iranian living standards in times of high inflation
The Iranian year 1401 (2022/2023) was exceptional in several respects. It was the first full year of President Ebrahim Raisi’s administration (August 5, 2021 to present), which proposed a new revolutionary vision that at long last would fulfill the promises of the 1979 revolution. It was also the year that the currency fell precipitously, by 52%, and prices registered a record rate of increase (300% annual rate in June 2022). The rapid increase of prices in the early part of the year, a result of the removal of food subsidies and the Russian invasion of Ukraine, raised fears of hyperinflation, which turned out to be highly exaggerated, as inflation moderated and settled at 45% for the year. Critics of the hardline president predicted that Raisi’s economic policies was severely hurting the poor and the middle class. We finally have the data to find out if they were right.
The answer is no. The prediction that inflation was making everyone poorer was suspect to begin with because it seemed to equate rising prices with falling living standards, which is a form of money illusion and incorrect. In reality, changes in living standards are the balance of changes in prices and incomes. Whereas prices are reported monthly and are readily observable, incomes are reported annually and are opaque. The fact that we don’t get the numbers on the price of labor (like the day laborer wage) along with the price of cucumbers is a shortcoming in economic reporting that feeds money illusion. Income data is reported by the Household Expenditures and Incomes Survey (HEIS) published annually by the Statistical Center of Iran (SCI). Last month SCI published a brief report of the HEIS for the Iranian year 1401 (21 March 2022 to 20 March 2023), and a week ago made the raw data available. The raw data is essential for independent analysis of living standards and to raise the credibility of the survey results (though professional skeptics distrust official data no matter what).
Since 1984, the survey has offered a detailed look into the economic lives of ordinary Iranians. Anyone with a computer and minimal training in data analysis can compare expenditures and incomes (expenditures often exceed income because they are more accurately reported), or measure real expenditures and incomes, taking out the effect of inflation. The 1401 survey shows that total nominal incomes increased by 58.1% in rural areas, 51.8% in urban areas, and 46.1% in the urban areas of the Tehran province. Except for Tehran, they compare favorably with the national inflation rate of 45%, though rural prices rose by 51.0% (still, a real income increase of about 7%).
So, with a few simple calculations one can dismiss as rubbish the right wing tropes that sanctions do not hurt ordinary Iranians or any money released to the Iranian government does not benefit them. Clearly, the benefits of the easing of sanctions after Trump and the higher price of oil that produced the modest economic growth of the last two years lifted most incomes.
That incomes rise with prices would not surprise the students of economics, who learn in their first semester of economics that prices are also incomes. The cost of a final good consists of payments to workers and owners of other inputs (such as land and capital), so as a matter of simple math any increase in the price of a product is automatically increase in someone’ else’s income. The price of an apple sold is income for the seller. Prices often rise because wages rise. Workers’ wages can rise in response to higher with prices, too, though not always in proportion.
Household consumption
The figure below (and the corresponding data in Table 1 at the end of this post) show average real per capita expenditures, or consumption per head, in USD PPP by region of residence (rural, urban, and urban Tehran). The share of population of these regions in round numbers that are easy to remember are 25, 60, and 15 percent. To obtain the USD PPP numbers I divide rials by the PPP conversion factor for 2022 published by the World Bank (62,780 rials per USD). In this post, I am mostly interested in the last two years, but there is no harm looking at the whole series since 1984 (I will need the other years for a point I raise at the end of this blog).
The first thing to notice in this graph is that during 2021-2022 (1400-1401) average real expenditures rose by 9.0% nationally, and in rural and urban areas by 9.5% and 12.2%, respectively. These numbers are close to changes in incomes. The urban Tehran province, which in the past has done better than the other two regions, did poorly, gaining in consumption in 2021 and losing in 2022. The rise of consumption per head is also consistent with the 10.3% growth of GDP and 7.5% growth of GDP per capita during 2020-2022, according to SCI national accounts.

It is best not to draw too many political conclusions from these numbers. It is misleading to compare the success of the Rouhani and Raisi administrations or the consequences of “neoliberal” vs. “revolutionary” economic policies because often the effect of economic policies extends beyond the administration that implements them and other factors (such as Trump or Russian invasion of Ukraine) intervene to complicate simple comparisons.
Poverty
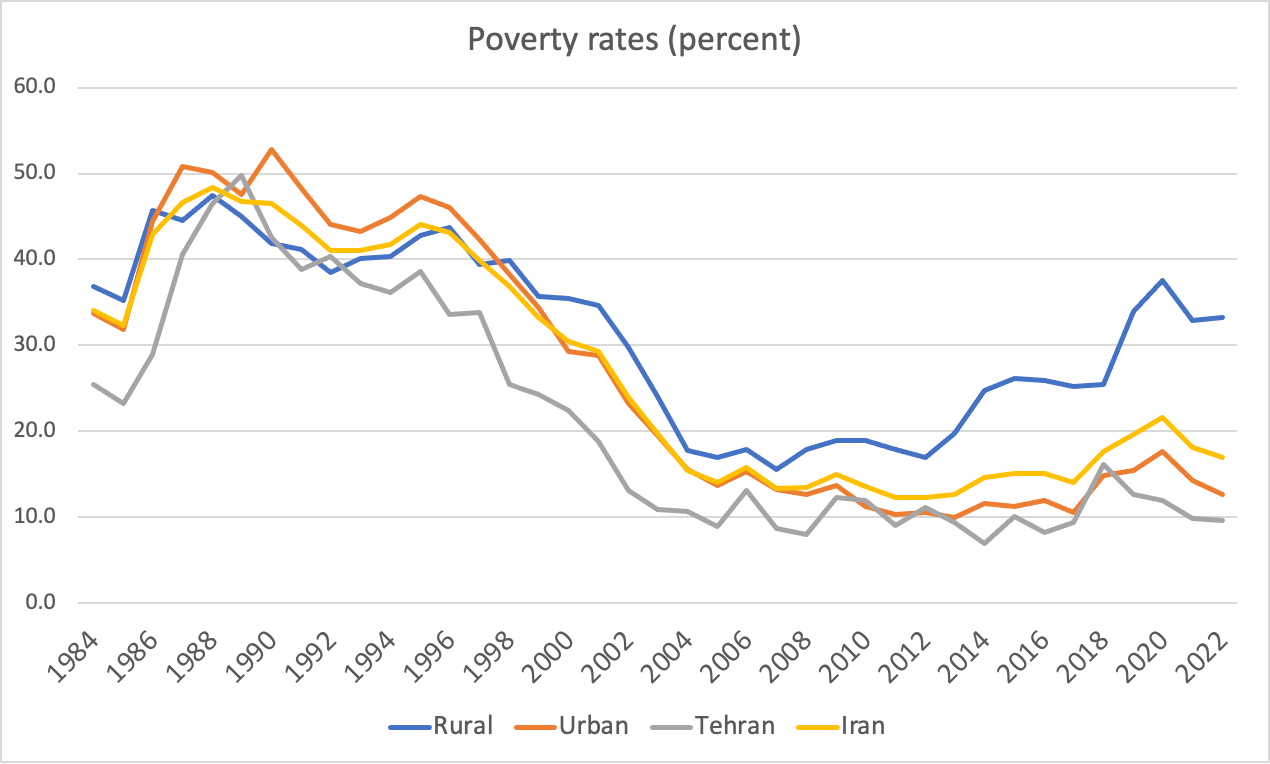
Next, let’s look at how the poor have fared since 2020. To define who is poor, I use poverty lines that differ by region (rural, urban, and Tehran) but stay constant over time. It is important to allow poverty lines to differ based on the cost of living but not change over time. I update the lines calculated for 2005 to 2022 prices, the same prices in which expenditures are measured. I further adjust the lines so they average close to the $7.60 PPP per person per day used by the World Bank for upper-middle-income countries (of which Iran is a precarious member, having fallen a notch in 2019). The poverty lines are: $6.20 in rural areas, $6.80 in urban areas, and $9.39 in Tehran. The gap between Tehran and rural areas has narrowed from a factor of 2 in 2005 to 1.5 in 2022 because of higher inflation in rural areas.
The graph below shows the percentage of the individuals living below the poverty line since 1984. Consistent with rising average consumption, the national poverty rate fell from 21.6% in 2020 to 17.0% in 2022 (see also Table 2 below). Poverty rates improved in this period in all regions, except for rural areas, where it worsened slightly in 2022. The incidence of poverty in rural areas has been rising faster than the rest od the country, at about twice the national average (33.3% vs 17.0%). This is most likely the result of a decade-long severe drought that has shrunk agricultural value added by 8% during the same period (SCI national accounts).
On a related note, income distribution improved slightly. Consistent with the decline in poverty rates, the Gini index fell from 0.410 in 2020 to 0.397 in 2022.
A few takeaways
The HEIS data offer a sobering conclusion for the critics of cash instead of product subsidy. Far from hurting the poor, removing regressive subsidies (like energy and red meat) and giving the savings to the poor as cash reduces poverty. Survey data show that neither Ahmadinejad’s 2010 energy subsidy reform nor Raisi’s 2022 reform of the subsidy for foreign exchange for imports of essential items, hurt the poor. It seems that the cash transfers offered as compensation not only prevented their expenditures from falling, they actually lifted some out of poverty (more on this in a later post).
One last point about the history of poverty reduction in Iran. As I was working on this post, I read in the Shargh daily about a brief conversation the late President Hashemi-Rafsanjani had recorded in his memoirs for October 1, 2000, with a prominent economist who had told him, “in Mr. Khatami’s administration poverty intensified, while in your administration it had declined.” Given the date of the conversation, this was about Khatami’s first term as president (1997-2001). The data I present here contradict this claim. In Khatami’s first term poverty fell from 39.9% to 30.5%, and then fell much more during his second term, to 14.0% in 2005. We do not know how much of this decline can be attributed to policy and how much to rising oil revenues. During the Rafsanjani administration (1989-1996), when oil prices were mostly low, poverty fell in Tehran but not in other areas. Rafsanjani’s main anti-poverty program was pushing health and education in rural areas, whose impact would be felt years later when Khatami was in office.
The memoir makes it clear that the contrast drawn between the poverty outcomes of the two administrations was a critique of the economic policies of “the left” — the reformists who rose to power under Khatami. But this raises several important questions that go beyond the trend in poverty. Did the incorrect account of the history of poverty reduction have a lasting effect on the country’s political economy? Could it have diminished support for the reformists during Khatami’s second term, deepening the rift between reformists and centrist politicians? Did this in turn help the hardliners and conservatives monopolize the politics of poverty and inequality reduction that would later help them win crucial elections in 2004 and 2009? Was the sloppy recounting of poverty rates in the 1990s a sign that two decades later the centrist Rouhani administration would show little interest in poverty and inequality in general and in cash transfers as a way to reduce them in particular? Did that cavalier attitude toward the most important promises of the Islamic Revolution — economic justice — help hardliners organize and regain power in 2021?
It is not a coincidence that, as I have shown before, the benefits of economic growth during the Rafsanjani, Khatami, and Rouhani administrations went mostly to higher income groups and the reverse happened under Ahmadinejad. Economic growth rates were higher overall but their benefits were less equally distributed,
These are not easy questions to answer. Nor has the neglect of redistributive policies been the main reason for decline in the welfare of Iranian families in the past decade and a half (think sanctions!). Lack of economic growth since 2010 has hurt rich and poor families alike and by much more than a stubborn Gini index. Sadly, political outcomes in Iran do not always reflect the wishes of the electorate, but public perceptions of how seriously political leaders fight for economic justice matters in other ways, especially in a country whose revolution promised just that.
TABLES
Table 1. Real expenditures per person per day in USD PPP
| Rural | Urban | Tehran | Iran | |
| 1984 | 10.1 | 12.2 | 20.1 | 12.3 |
| 1985 | 10.2 | 12.5 | 20.8 | 12.5 |
| 1986 | 8.9 | 10.6 | 17.6 | 10.8 |
| 1987 | 8.7 | 9.8 | 14.9 | 10.0 |
| 1988 | 8.1 | 9.3 | 13.5 | 9.4 |
| 1989 | 8.7 | 9.6 | 13.5 | 9.7 |
| 1990 | 10.1 | 8.7 | 14.6 | 10.2 |
| 1991 | 10.2 | 9.7 | 15.5 | 10.8 |
| 1992 | 10.2 | 10.3 | 15.7 | 11.1 |
| 1993 | 9.5 | 10.1 | 15.9 | 10.8 |
| 1994 | 9.6 | 9.8 | 16.6 | 10.8 |
| 1995 | 9.4 | 9.4 | 16.1 | 10.5 |
| 1996 | 9.2 | 9.5 | 17.3 | 10.6 |
| 1997 | 9.8 | 10.0 | 17.6 | 11.1 |
| 1998 | 10.1 | 10.7 | 19.1 | 11.8 |
| 1999 | 10.6 | 11.7 | 20.1 | 12.6 |
| 2000 | 10.6 | 12.8 | 21.6 | 13.4 |
| 2001 | 10.7 | 13.2 | 24.1 | 14.0 |
| 2002 | 11.6 | 14.5 | 27.6 | 15.6 |
| 2003 | 12.6 | 15.3 | 27.3 | 16.4 |
| 2004 | 14.7 | 17.6 | 28.0 | 18.4 |
| 2005 | 15.1 | 18.6 | 28.5 | 19.0 |
| 2006 | 15.2 | 18.8 | 28.8 | 19.3 |
| 2007 | 15.7 | 19.7 | 31.2 | 20.2 |
| 2008 | 14.3 | 18.2 | 29.2 | 18.9 |
| 2009 | 14.4 | 18.4 | 26.6 | 18.7 |
| 2010 | 14.3 | 19.2 | 26.0 | 19.0 |
| 2011 | 13.0 | 17.5 | 26.6 | 17.5 |
| 2012 | 13.0 | 16.9 | 26.5 | 17.3 |
| 2013 | 11.8 | 16.7 | 26.2 | 16.8 |
| 2014 | 11.3 | 16.4 | 27.4 | 16.7 |
| 2015 | 11.0 | 16.2 | 28.4 | 16.6 |
| 2016 | 11.0 | 16.5 | 29.3 | 17.0 |
| 2017 | 11.6 | 17.8 | 30.7 | 18.3 |
| 2018 | 11.6 | 16.0 | 28.6 | 16.9 |
| 2019 | 10.0 | 15.2 | 28.4 | 16.0 |
| 2020 | 9.5 | 14.7 | 27.6 | 15.5 |
| 2021 | 10.2 | 16.1 | 28.7 | 16.7 |
| 2022 | 10.4 | 16.5 | 27.9 | 16.9 |
Table 2. Poverty rates
| Rural | Urban | Tehran | Iran | |
| 1984 | 36.8 | 33.7 | 25.5 | 34.1 |
| 1985 | 35.2 | 31.9 | 23.2 | 32.3 |
| 1986 | 45.7 | 44.4 | 28.9 | 42.9 |
| 1987 | 44.5 | 50.8 | 40.6 | 46.6 |
| 1988 | 47.4 | 50.1 | 46.5 | 48.4 |
| 1989 | 45.0 | 47.6 | 49.8 | 46.8 |
| 1990 | 41.9 | 52.8 | 42.5 | 46.5 |
| 1991 | 41.2 | 48.3 | 38.8 | 43.9 |
| 1992 | 38.5 | 44.1 | 40.4 | 41.1 |
| 1993 | 40.1 | 43.2 | 37.2 | 41.0 |
| 1994 | 40.4 | 44.9 | 36.1 | 41.7 |
| 1995 | 42.8 | 47.3 | 38.6 | 44.1 |
| 1996 | 43.7 | 46.1 | 33.6 | 43.1 |
| 1997 | 39.4 | 42.3 | 33.8 | 39.9 |
| 1998 | 39.9 | 38.2 | 25.4 | 36.8 |
| 1999 | 35.7 | 34.4 | 24.3 | 33.3 |
| 2000 | 35.4 | 29.3 | 22.4 | 30.5 |
| 2001 | 34.6 | 28.8 | 18.8 | 29.3 |
| 2002 | 29.8 | 23.2 | 13.1 | 23.9 |
| 2003 | 24.1 | 19.5 | 10.9 | 19.7 |
| 2004 | 17.8 | 15.6 | 10.7 | 15.5 |
| 2005 | 16.9 | 13.7 | 8.9 | 14.0 |
| 2006 | 17.9 | 15.3 | 13.1 | 15.8 |
| 2007 | 15.6 | 13.2 | 8.7 | 13.3 |
| 2008 | 17.9 | 12.6 | 8.0 | 13.5 |
| 2009 | 18.9 | 13.7 | 12.3 | 15.0 |
| 2010 | 18.9 | 11.3 | 11.9 | 13.6 |
| 2011 | 17.9 | 10.3 | 9.1 | 12.3 |
| 2012 | 16.9 | 10.5 | 11.1 | 12.3 |
| 2013 | 19.7 | 10.0 | 9.4 | 12.7 |
| 2014 | 24.8 | 11.6 | 7.0 | 14.6 |
| 2015 | 26.1 | 11.2 | 10.1 | 15.1 |
| 2016 | 25.9 | 11.9 | 8.2 | 15.1 |
| 2017 | 25.2 | 10.6 | 9.4 | 14.1 |
| 2018 | 25.5 | 14.9 | 16.1 | 17.7 |
| 2019 | 33.9 | 15.5 | 12.6 | 19.6 |
| 2020 | 37.5 | 17.7 | 12.0 | 21.6 |
| 2021 | 32.9 | 14.3 | 9.9 | 18.1 |
| 2022 | 33.3 | 12.6 | 9.6 | 17.0 |


[…] И покрај речиси 9% раст на БДП и значително подобрување на приходите, инфлацијата изнесува 30%, а земјата е сé уште […]
[…] И покрај речиси 9% раст на БДП и значително подобрување на приходите, инфлацијата изнесува 30%, а земјата е сé уште […]
[…] struggling to fulfill its promise to fix the economy. Despite nearly 9% GDP growth and significant improvements in incomes, inflation is running at 30%, and the country is still weighed down by international sanctions. The […]