Inflation trend in Iran: much confusion about nothing
Surprisingly, despite the fact that timely information about the speed with which prices rise is published regularly at the end of each month, there is a debate (link in Persian) whether inflation is rising or falling. The facts are not in dispute, but their interpretation is. The monthly rate of inflation has slowed down considerably in the last three months but that is not the only way to measure inflation.
Prices rose by 12.2% in Khordad (May 20 to June 21), 4.6% in Tir and 2.0% in Mordad. The equivalent annual rates (compounded over 12 months) are more dramatic: 299%, 76%, and 26%, clearly a downward trend. If you believe that inflation is the speed of price increases, there is no question that inflation has slowed by quite a bit.
The monthly inflation in Khordad was unprecedented and understandable. It followed two shocks to food prices arising from the the removal of subsidies for import of basic commodities, mainly food items, and from the Russian invasion of Ukraine. Given the cost-push source of the recent rapid increase in prices, it is no surprise that inflation has slowed once the original shock has worked its way through the system. Whether inflation continues at the slower pace of Mordad depends on other things, including the prospects for a nuclear deal.
But the question of the trend for the last three months should in principle be easy to resolve with existing data. The reason why it has not is because of different ways inflation is measured in Iran. There is the so-called point-to-point measure of inflation, which is usually defined as the average rate of CPI growth for the past 12 months. This measure increased from 40.5% in Tir to 41.4% in Mordad. There is yet another definition of point-to-point which SCI uses, and it divides this month’s CPI by the CPI of the same month a year ago. This measure produces a higher rate, but it declined from 54.0% in Tir to 52.2% last month.
That is all that the CPI data can tell us. Different measures tell somewhat different stories, but at least two indicate declining inflation. The monthly rate is the measure that I prefer for Iran’s turbulent economy, and one that I have used in the past to calm hyper-inflation fears stoked by the likes of Steven Hanke who has proved wrong multiple times predicting Venezuelan-style chaos in Iran.
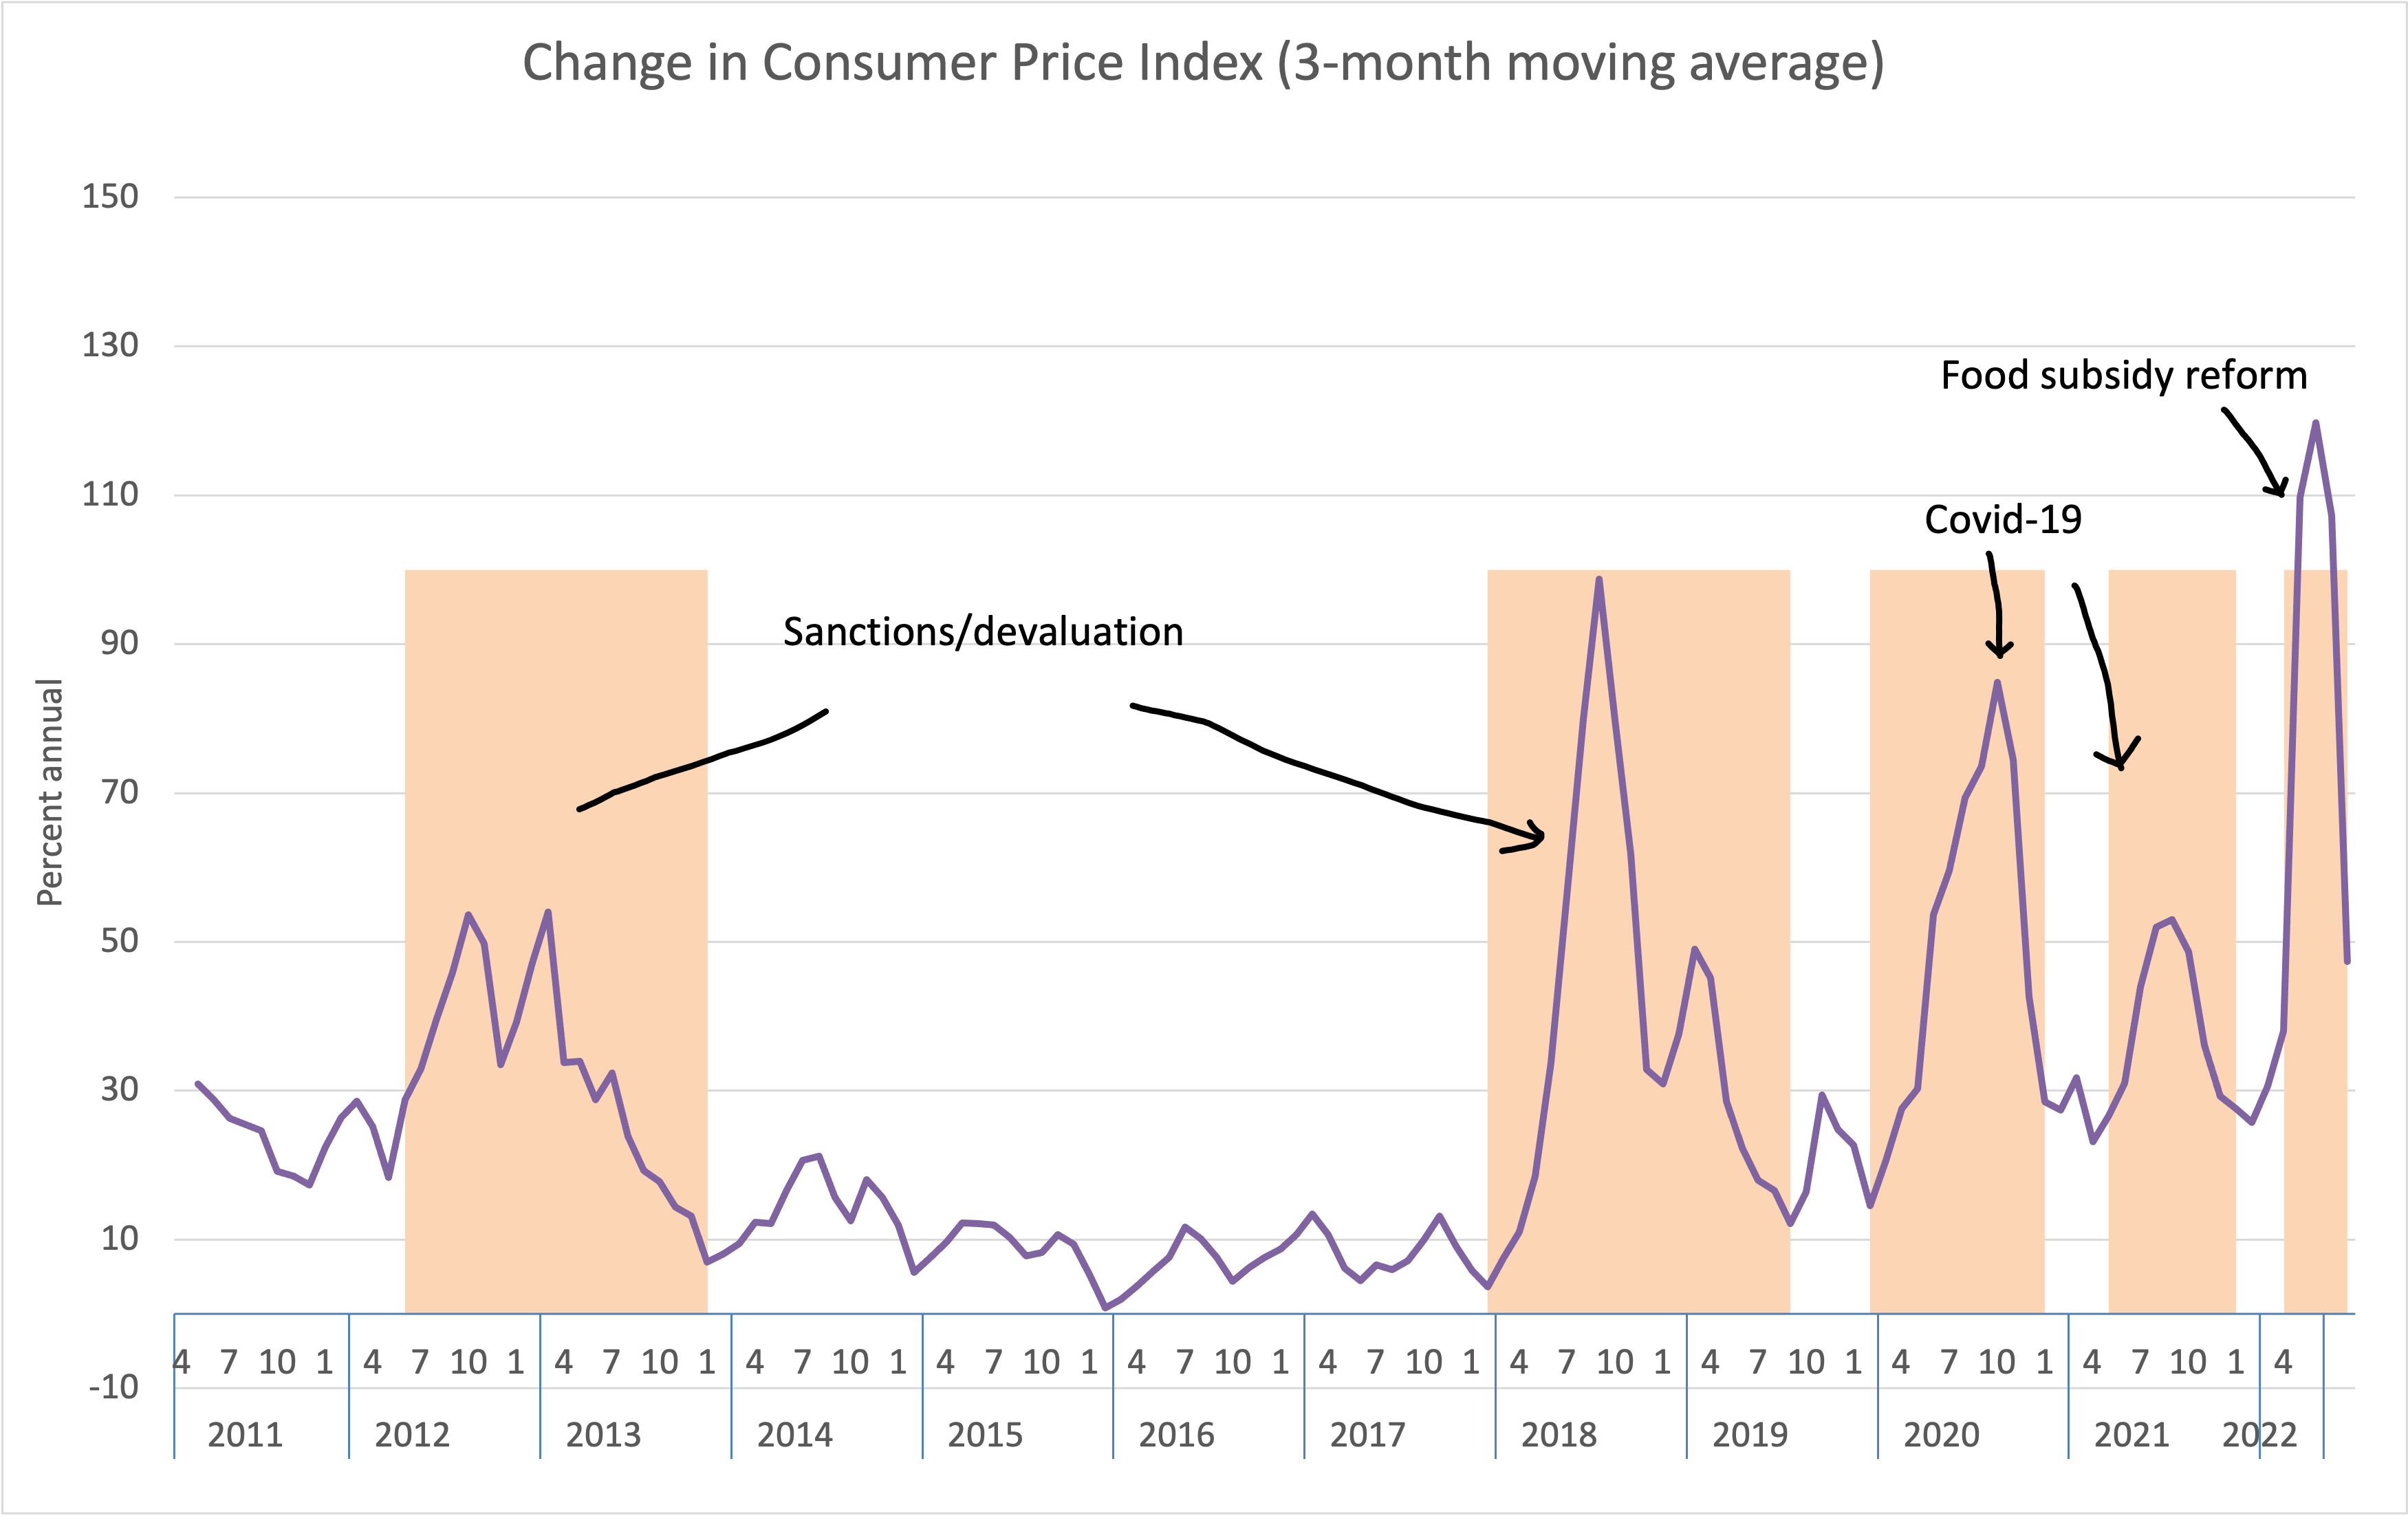
The graph below, which is an updated version of similar graphs that have appeared in this blog, uses 3-month moving averages to highlight the periodicity of inflationary pressures. The graphs reveals five bouts of high inflation, each caused by an external shock that raised prices suddenly but subsided a few months later. In between, you can see the underlying endemic rate of inflation, caused by lack of resources to meet various demands on public expenditures. Hyperinflation occurs when external shock cause rising inflation, which is not what this graph displays.
A note of clarification: There is no doubt that in the first half of 1401 inflation is running higher than 1400, probably by 10 percentage points. However, this does not contradict the fact that in the last couple months inflation has been declining.


As I said, if prices rise for external reasons, liquidity will rise afterwards to prevent a decline in employment.
While thanking you for your fruitful content, which I have always benefited from, a question has recently been raised in Iran’s scientific environment about inflation, and I would be happy to know your opinion on this matter. Do you think whether casuality of Iranian inflammation, in particular after the Islamic revolution, is exchange rate or liquidity?
*inflammation=inflation
Good question. In some sense, both exchange rate shocks and increase in liquidity cause inflation. Increase in liquidity is needed for prices to rise, like oil to make a car’s engine spin, so this is an obvious relationship that should not be always interpreted as causal. The question to ask is why liquidity rises. Does it rise because the Central Bank prints money to cover a budget deficit, or because the Central Bank accommodates an external price shock? As you see in the graph, every time sanctions tightened, the rial collapsed causing local prices to rise. The Bank can let liquidity rise to help businesses whose costs have risen to operate at the same rate or refuse to do so and keep the money supply constant. In the latter case, instead of prices rising, output and employment decline. This may seem a small price to pay to keep inflation down when you are in full employment, as is the US in 2022, but in the case of Iran its cost is huge.
From: Tyranny of numbers comment-reply@wordpress.com Date: Tuesday, September 6, 2022 at 7:17 AM To: Salehi-Isfahani, Djavad salehi@vt.edu Subject: [Tyranny of numbers] Comment: “Inflation trend in Iran: much confusion about nothing”
Thank you and I appreciate you for your deep answer. But again a question arises for me :
Why should we not always interpret the correlation between inflation and liquidity as a cause and effect relationship? While you have interpreted the relationship between sanctions and inflation as a cause and effect relationship?