Five figures show the losers and winners of economic growth under different presidents of the Islamic Republic
Iran has been under four different presidents since the end of the war with Iraq in 1988, each with its own style and philosophy. As the June presidential election nears, it is interesting to look back to the past and ask how each administration did in terms of inequality, and how the poor, the middle class and the rich fared under them.
I try to answer this question in this post using a simple graphic tool, the Growth Incidence Curve (GIC), pioneered by Ravallion and Chen (2003). The GIC depicts average growth rate for each decile for a specified period of time. The graphs used here use the micro data files of Iran’s Expenditure and Income Surveys, available at the site of the Statistical Center of Iran (SCI).
The GIC is a specific but a very intuitive way to measure changes in inequality. If the curve is flat, everyone benefits equally from economic growth. If the income of the higher deciles of the income distribution grow faster than those of the poor, the curve will slope upward and if the reverse is the case it will slope downward. As we see below, the there is quite a bit of variation in how different administrations affected income growth for different income groups. We do not see these variations easily in the more famous Gini index of income inequality because it is less sensitive to changes in income the bottom and the top of the distribution. (For estimates of inequality indices for Iran, see my articles here and here).
I choose real per capita expenditures as my welfare measure. SCI surveys includes data on incomes and earnings but they are considered less reliable than expenditures that are constructed from information on expenditures on hundreds of items.
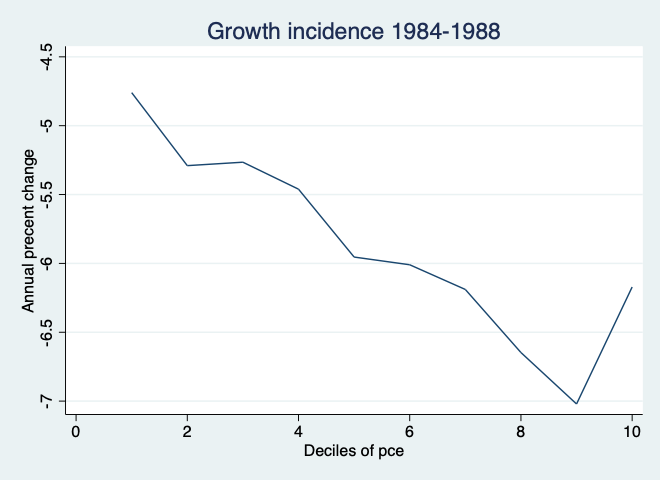
Starting with 1984, when the micro data for the first expenditure survey is available, we get a glimpse of changes during the war years (1980-1988). For most of that period, Iran’s economy was under strict rationing and was led by a left-leaning coalition that included Mir-Hossein Mousavi as prime minister and Ayatollah Ali Khamenei, the current Supreme Leader, as president. The position of the prime minster was eliminated in 1989.
The GIC for the period 1984-1988 shows that, as one would imagine, on the whole the war economy favored the poorer households. Living standards declined for all groups, but generally less so for the poorer deciles of per capita expenditures.
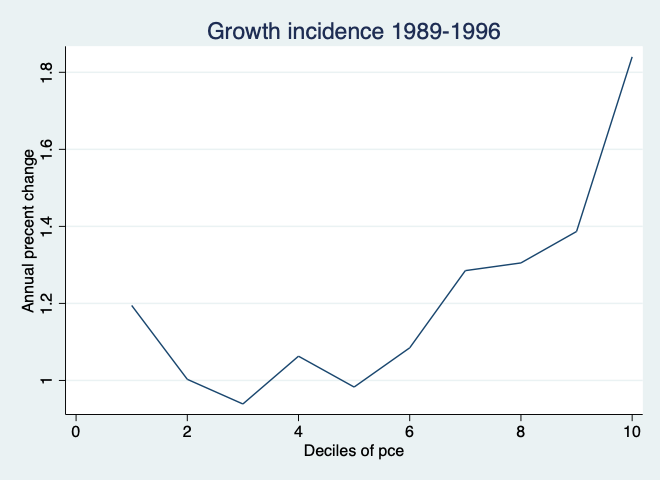
Next, consider the GIC during the two terms of President Akbar Hashemi Rafsanjani (1989-1997). (All presidential terms actually end in mid-year, but I take the last full year as the end of each presidential term.) We see a remarkable change from the previous period’s pattern. While average real expenditures increased for all income groups, the top deciles did much better. Rafsanjani’s detractors attribute this to his what they call his structural adjustment policies recommended by the IMF and the World Bank, but Iran was not a borrower at a scale from these institutions that had to restructure to be able to borrow more.
The real reason may be that greater reliance on the market mechanism, as Rafsanjani’s reforms attempted to do, generate economic growth but of the unequalizing kind.
Rafsanjani’s overtly pro-market years were followed by President Mohammad Khatami (1997-2005) who promised economic growth with dignity (ezzat). Rafsanjani boasted that his greatest accomplishment while in office was to take the negative stigma out of wealth accumulation — obviously reacting to the policies and the rhetoric of early revolutionaries who favored redistribution. Khatami projected a more social-democratic posture, and many of his cabinet appointments were reformists who has previously opposed Rafsanjani’s neo-liberal policies.
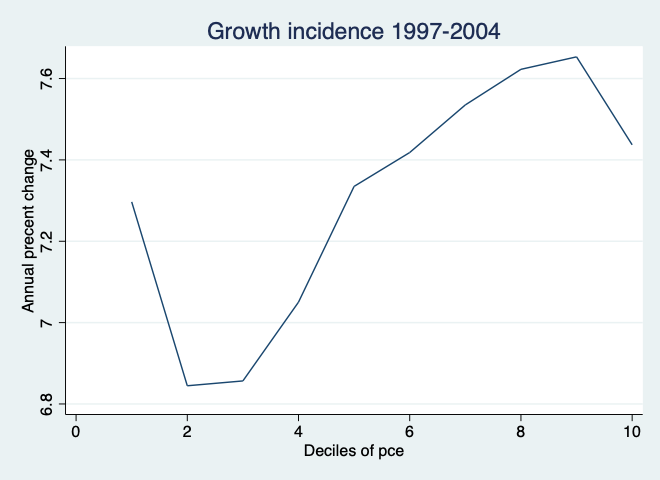
Nevertheless, as Figure 3 shows, except for the bottom decile, the rest of the GIC slopes upward. Khatami’s tenure saw an acceleration of the economic growth started under his predecessor but, his rhetoric notwithstanding, the fruits of that growth went disproportionately to the more affluent.
Khatami’s successor, Mahmoud Ahmadinejad, brought a seismic shift to Iran’s politics and economics. He was a populist who favored giving cash to the poor and bringing the oil wealth “to people’s dinner table.” He started with ad hoc and cash transfers on a first-come-first served basis, but later switched to a much larger program in which energy subsidies were replaced with generous cash transfers.
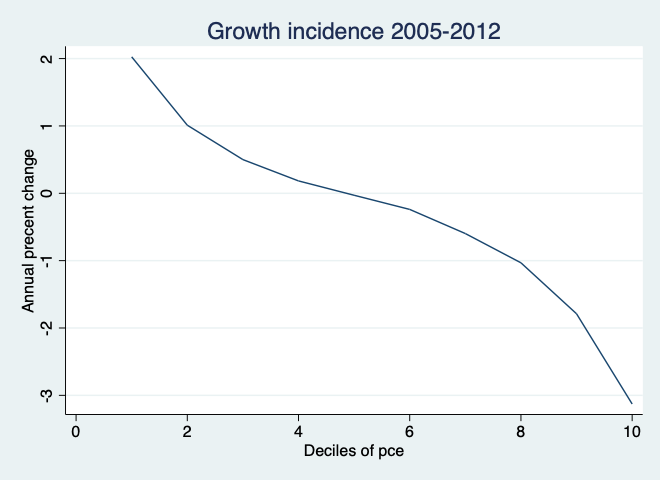
The net result seems to be a reversal of the trends in inequality during the two previous administrations. Inequality decreased but at great cost. Economic growth slowed down and and most income deciles lost, as Figure 4 shows. Only the bottom 30% managed to eked out a small positive growth, less than 2% per year. This was largely because of the universal cash transfer program that increased incomes of the poorest deciles by more than one-third in 2011. The overall negative effect on the economy was due to his lack of attention to private investment, which suffered as the country squandered much of the oil boom of the late 2000s on imports, which lifted consumption but not employment. His dismissive attitude toward international sanctions helped the US unite the security Council to pass the UN resolution 1929, on which the Obama administration built its secondary sanctions regime, which still haunts Iran. Ahmadinejad’s last 18 months of office was marred by currency depreciation and inflation.
Finally, in 2013, Iranian voters made another about turn to elect the moderate president Hassan Rouhani, a close ally of Rafsanjani. Rouhani tried hard to undo the damage done to Iran’s economy as a result of UN and US sanctions, and to promote private sector development. He did succeed in repealing the UN sanctions, which is not a small accomplishment, and almost succeeded in ending all US sanctions, but his luck ran out when Donald Trump became president in 2017.
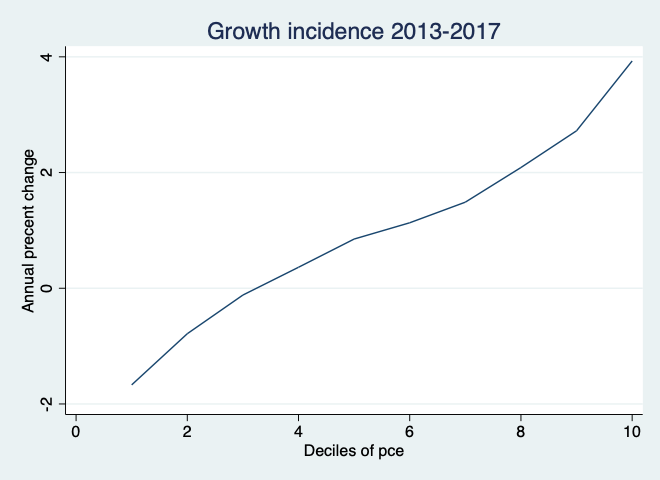
It is more informative to separate Rouhani’s tenure into before (2013-2017) and after Trump (2018-2019). Data for his last year in office 2020, is not yet available. In the before-Trump period (Figure 5A), at first the economy grew slowly, thanks to the progress being make in negotiations for the nuclear deal. When the deal was singed in July 2015 and sanctions started to ease in 2016, the economy took off, growing by 13% in 2016 and 7% in 2017. But, alas, this growth favored the rich, as Figure 5A shows.
The next two years, after Trump, saw the complete unraveling of Rouhani’s economic plans for Iran (Figure 5B). Trump imposed his maximum pressure sanctions in May 2018, which reduced Iran’s oil exports to a trickle and froze 90% of all the reserves Iran had abroad ($122.5 billion in 2018, according to the IMF). Growth took a dive, from +7% to -6%. The impact of this reversal on ordinary people’s living standard, as I have documented elsewhere, was dramatic. In Figure 6, we notice an inverted U-shaped pattern: while all deciles lose, the dropping income for the 20% at the bottom and the greater. The greater loss at the top is not surprising. Downturns usually reduce the share of the rich, perhaps because their incomes are closely tied to the fortunes of the government and the oil rent, which fall first during downturns.
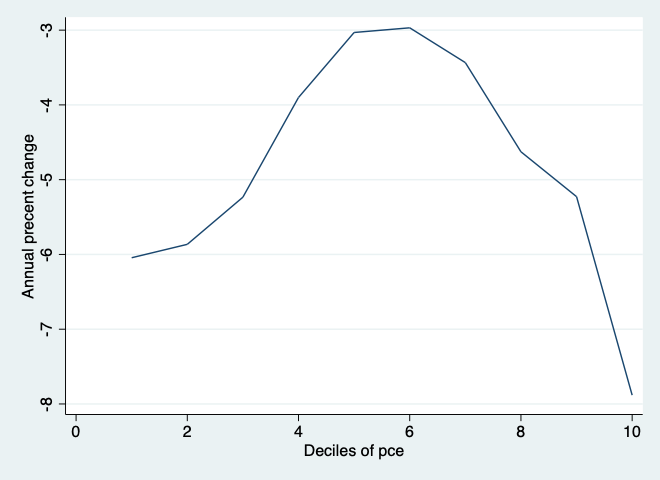
As I have noted here and here, polls indicate that Iranian moderates, and Rouhani in particular, have lost much of their popularity since 2017. Some of the blame obviously goes to Donald Trump, who alone is responsible for Iran’s severe recession. But Rouhani bears the responsibility for the greater loss of income for the lowest three deciles. His greater attention to the middle class, which he considers his political base, and neglect of the poor, is why the GIC curve is shaped as it is.


[…] восстановление, вызванное СВПД, привело к увеличению реальных расходов на душу населения у 20% самых богатых на 15,6%, в то же время сокращая […]
[…] populaire. Il n’y a aucun doute là-dessus. Le résultat de cette élection semble indiquer un changement dans la perception populaire des mérites de la réabsorption « iranienne » dans la sphère culturelle et économique […]
[…] Il n’y a aucun doute là-dessus. Le résultat de cette élection semble indiquer un changement dans la perception populaire des mérites de la réabsorption « iranienne » dans la sphère culturelle et […]
[…] support this time. Of that, there can be no doubt. This election outcome seemingly speaks to a shift in popular perception of the merits of Iranian’ re-absorption into the western cultural and economic […]
[…] support this time. Of that, there can be no doubt. This election outcome seemingly speaks to a shift in popular perception of the merits of Iranian’ re-absorption into the western cultural and economic […]
[…] support this time. Of that, there can be no doubt. This election outcome seemingly speaks to a shift in popular perception of the merits of Iranian’ re-absorption into the western cultural and economic […]
[…] support this time. Of that, there can be no doubt. This election outcome seemingly speaks to a shift in popular perception of the merits of Iranian’ re-absorption into the western cultural and economic […]
Very interestimng, Djavad. ‘Learned a lot!
Thank you Ragui!
From: Tyranny of numbers
Reply-To: “comment+2i1eh_sdruy5bubn9pb9wzhmsd@comment.wordpress.com”
Date: Monday, May 3, 2021 at 10:06 AM
To: Djavad Salehi-Isfahani
Subject: [Tyranny of numbers] Comment: “Five figures show the losers and winners of economic growth under different presidents of the Islamic Republic”