Will a weak economy affect Iran’s parliamentary election this week?
Iran’s parliamentary election this Friday promises to be very consequential for the continuation of Rouhani’s reforms — “fateful” (sarnevesht saz), is how former president Rafsanjani described it. But it is taking place at a tough economic time. The nuclear deal and the removal of sanctions are beginning to have an effect, but not soon enough for people to feel the benefits of reconnecting to the global economy in their pocketbook.
Industry, which was hardest hit by sanctions, continues to bleed jobs. Employment figures (see table below) released by the Statistical Center of Iran (SCI) show the loss of 300,000 industrial jobs between the summer of 2013, when Rouhani took office, and this past summer. Most of those jobs seem to have reappeared in the service sector, so the total number employed actually increased. But the service sector sometimes acts as the employer of last resort (“sitting in a relative’s shop or real estate agency”), so I would not call this an overall improved employed picture.
SCI’s latest report for fall 1394 (2015), does not give the numbers for employment, only rates, so I cannot make the same comparison from fall to fall. But the numbers that are available do not conflict with the conclusion I draw from the data for summer 2015. The share of employment in industry fell from 34.5% in fall 2013 to 32.6% in fall 2015 (again services picking up some of that, its share rising from 48.0% to 49.8%).
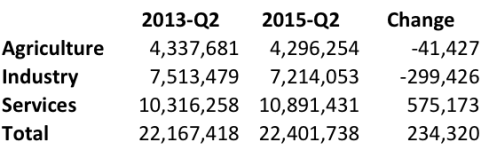
Source: SCI publications.
The employment rate did not change from fall to fall, staying at 33% of the population 10 years and older. I do not make much of the unemployment rates published by SCI because being active (and by the same token, unemployed) is a shifty concept when the majority of those employed have college degrees and are probably awaiting a job they consider appropriate.
The income and expenditure data do not come as frequently but also indicate tough economic times for the average household and for the poor in particular. The latest available data are for 1393 (2014/15). I have explored these data briefly and estimate that both poverty and inequality have increased during the first 18 months of Rouhani’s tenure. This is, of course, hardly surprising given the 80% decline in the price of oil since he took office, but it is not unrelated to the fact that energy prices have increased twice since he took office without any additional compensation to the poor.
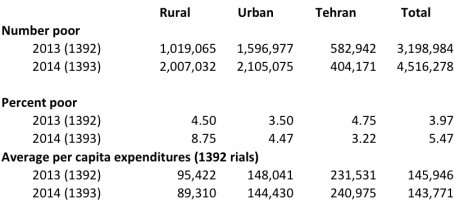
Poverty rates, 1392-93 (2013/14-2014/15)
Note: These poverty rates are using individual data and calculated with regional poverty lines first estimated for 2005. They were updated to 1392 (2013/14) for 62 regions (31 provinces by rural and urban) and using the Central Bank of Iran’s Consumer Price Index. They average to roughly $5 per person per day in PPP USD, which is above the usual international poverty line of $3 per day, but is consistent with other estimates for Iran. It is roughly 7,200,000 rials per month for a family of 4 in 2015.
Source: SCI HEIS data files.
As the above table shows, the poverty rate in rural areas increased from 4.50% to 8.75%, and in urban areas (minus Tehran) from 3.50% to 4.47%. Only in Tehran did it decline. My estimates could be affected by the fact that I use the same inflation rate for all households. Since food prices rose by less during 2013-14 (some prices in fact fell) and food comprises more of a rural family’s expenditures, I may be over-estimating rural poverty and under-estimating poverty in Tehran in 1393 (2014/15).
Not surprisingly, the same data shows that inequality has also deteriorated. The Gini index rose from 0.374 to 0.388; the GE(-1) index, which is more sensitive to changes in low incomes, rose from 0.277 to 0.319; the GE(2), which is more sensitive to changes in high incomes, rose from 0.360 to 0.402; and the 90/10 expenditure ratio increased from 5.24 to 5.56.
Reports by the IMF and others indicate that the economy did not improve in the current year (1394), so these numbers may well be telling a more-up-to-date story.

Inequality indices, 1392-92
Note: Inequality estimates are based on per capita expenditures.
Source: SCI HEIS data files.
Most of these dismal figures are the result of the oil price collapse during this period and not the policies of the Rouhani administration; even less so for policies that it is likely to pursue going forward. What happened in 2014/15 will not matter for economic growth in coming years when the removal of sanctions takes full effect and further economic reforms are put in place with the help of a new, reform-friendly parliament, unless if they prevent such a parliament from getting elected in the first place. Adding 1.3 million to the population in poverty and loss of good industrial jobs is not without political consequence, so do not be too surprised if the reception to the nuclear deal at the ballot box later this week is not as warm as it has been in Iran’s business press.


[…] My calculations, based on expenditure and income survey data, show that in the 2014-15 fiscal year the average per-person household expenditures fell by 6.4% in rural areas and by 2.4% in urban areas; only in Tehran did it increase by 4%. The poverty rate has increased, sending 1.3 million people below the poverty line of roughly $5 per person per day, and income inequality has also increased. We will not know for some time the numbers for the current Iranian year that ends in a month, but the odds are that they will not tell a better story. […]