Iran poverty rates updated
Recently the World Bank updated the poverty lines it publishes for countries in different income categories from the 2011 PPP version to 2017. The WB lines are used primarily to obtain comparable poverty rates across the globe. They often differ from national poverty lines that governments use to decide who gets anti-poverty assistance and who does not. Iran does not have an official national poverty line, though from time to time official reports appear that offer poverty lines, as did the Ministry of Labor earlier this month. The Iranian government bases its cash and in-kind assistance to the poor on its own criteria. In this post, I update my previous estimates of Iranian poverty rates to the new WB poverty lines.
The old poverty lines, based on the 2011 Purchasing Power Parity (PPP) US dollars, ranged from $1.90 for low-income countries to $5.50 for upper middle-income countries, to which Iran belonged before 2020. The new lines are based on the 2017 PPP revisions and are higher, ranging from $2.50 to $6.85 PPP (see here for a description of the change and here for what it means for poverty analysis).
One complication in doing this is that the 2017 PPP dollars reduced the value of Iran’s GDP by about 30%, lowering its classification from upper to lower middle-income. If I were to follow the new classification, I would have to lower Iran’s poverty line, from $5.50 in 2011 to $3.65 in 2017 PPP, the new value for lower middle-income countries. I prefer to stick with the old classification but use the $6.85 line, in part because I do not see the logic of the reclassification for Iran –Iran’s GDP in real terms has been stagnant lately but no sign that it contracted by 30%. Iranian data do not justify such a large change in GDP.
The update involves these steps:
- The World Bank average line must be weighted for people living in different parts of Iran. For this I use 62 regional weights based on poverty lines that I estimated for 2005 a while back and is explained in this unpublished paper written with Ali Hashemi in 2007. This is an important step in correcting for differences in the cost of living across Iran.
- I then inflate these lines to 2021 using separate Consumer Price Indices (CPI) for rural and urban areas. The 2005 lines are rather old, but separate adjustments for rural areas allows for the higher inflation for food, which is the main reason for faster increase in the cost of living in rural areas relative to urban. The adjustment is the ratio of CPI in 2021 to 2005, which are factors of 23.2 and 17.8 for rural and urban areas, respectively.
- The national average of these rates is 196,961 rials per person per day, which is $5.05 in 2021 USD PPP (using the PPP conversion factor for private consumption of 39,002 rials per USD in 2021, accessed from the World Bank WDI site on January 10, 2023). This value needs to be increased by 11%, which is how much US prices rose between 2017-2021 according to the US Department of Labor. This yields the 2021 line of $7.60, which means all poverty lines in rials should be multiplied by 1.50 (=7.60/5.05). The new average is 296,417 rials per person per day.
The results are below, graphically and in tabular form.

Figure 1. New poverty rates for Iran, 1984-2021.
Notes: These rates use regional poverty lines that average to the World Bank’s revised poverty line for upper middle-income countries of $6.85 per person per day in 2017 international dollars ($7.60 in 2021).

What do these new calculations tell us? Unsurprisingly, the new poverty rates are higher than I estimated and used in this blog and a recent paper before. But the trends are very similar: We note a sharp increase in poverty during the war years that last until the early 1990s, followed by a strong downward trend after 1995 and lasting till 2011, when sanctions reversed this trend.
I am quick to blame sanctions for the change in trend because I cannot find a better explanation. There are many factors that inhibit economic growth and increase poverty in Iran, like corruption, mismanagement and collapse in oil prices, but none of these changed significantly around 2011. This is the point I argue in my aforementioned paper.
These estimates show a steep increase in rural poverty in the last ten years, which may have resulted from a combination of sanctions and climate change. Iran has been under a severe drought that has hampered agriculture production for longer than a decade. It is also likely that some government subsidies, like the bread subsidy which is channeled through bakeries, do not reach the poor in rural as easily as urban areas. The fact that the urban districts of the Tehran province have suffered least may be pointing to the same problem.
Also worth noting is the decline in poverty in the last two years, 2020-2021, which is more pronounced in urban than rural areas. This is consistent with the findings of the latest expenditure survey regarding living standards, which I wrote about last August.
These estimates of poverty are still lower than the estimates recently provided by the Ministry of Labor (payesh fagr dar sal 1400), attached to the end of this post. This is because the Ministry’s poverty lines are higher than mine — 560,667 rials per person per day, compared to 296,417. Converted to PPP dollars, it is $14.8, which is much higher than the World Bank line for upper middle-income countries of $6.85 ($7.60 in 2021).
In principle, there is no objection for the government to pick a much higher rate than is used internationally, except that, as we say in Persian, he who wields a large stone does not intend to hit. What is the point of setting a poverty line that is not affordable or enforceable given the country’s resources? In a society in which income assistance for the poor must be paid with taxes imposed on higher income people, setting the poverty line too high is not being serious about poverty reduction. In Iran, an extravagant threshold for poverty is often a way to put pressure on the government to use its non-tax income (oil income or savings from subsidies) to help the poor, or to simply put down the government’s performance.
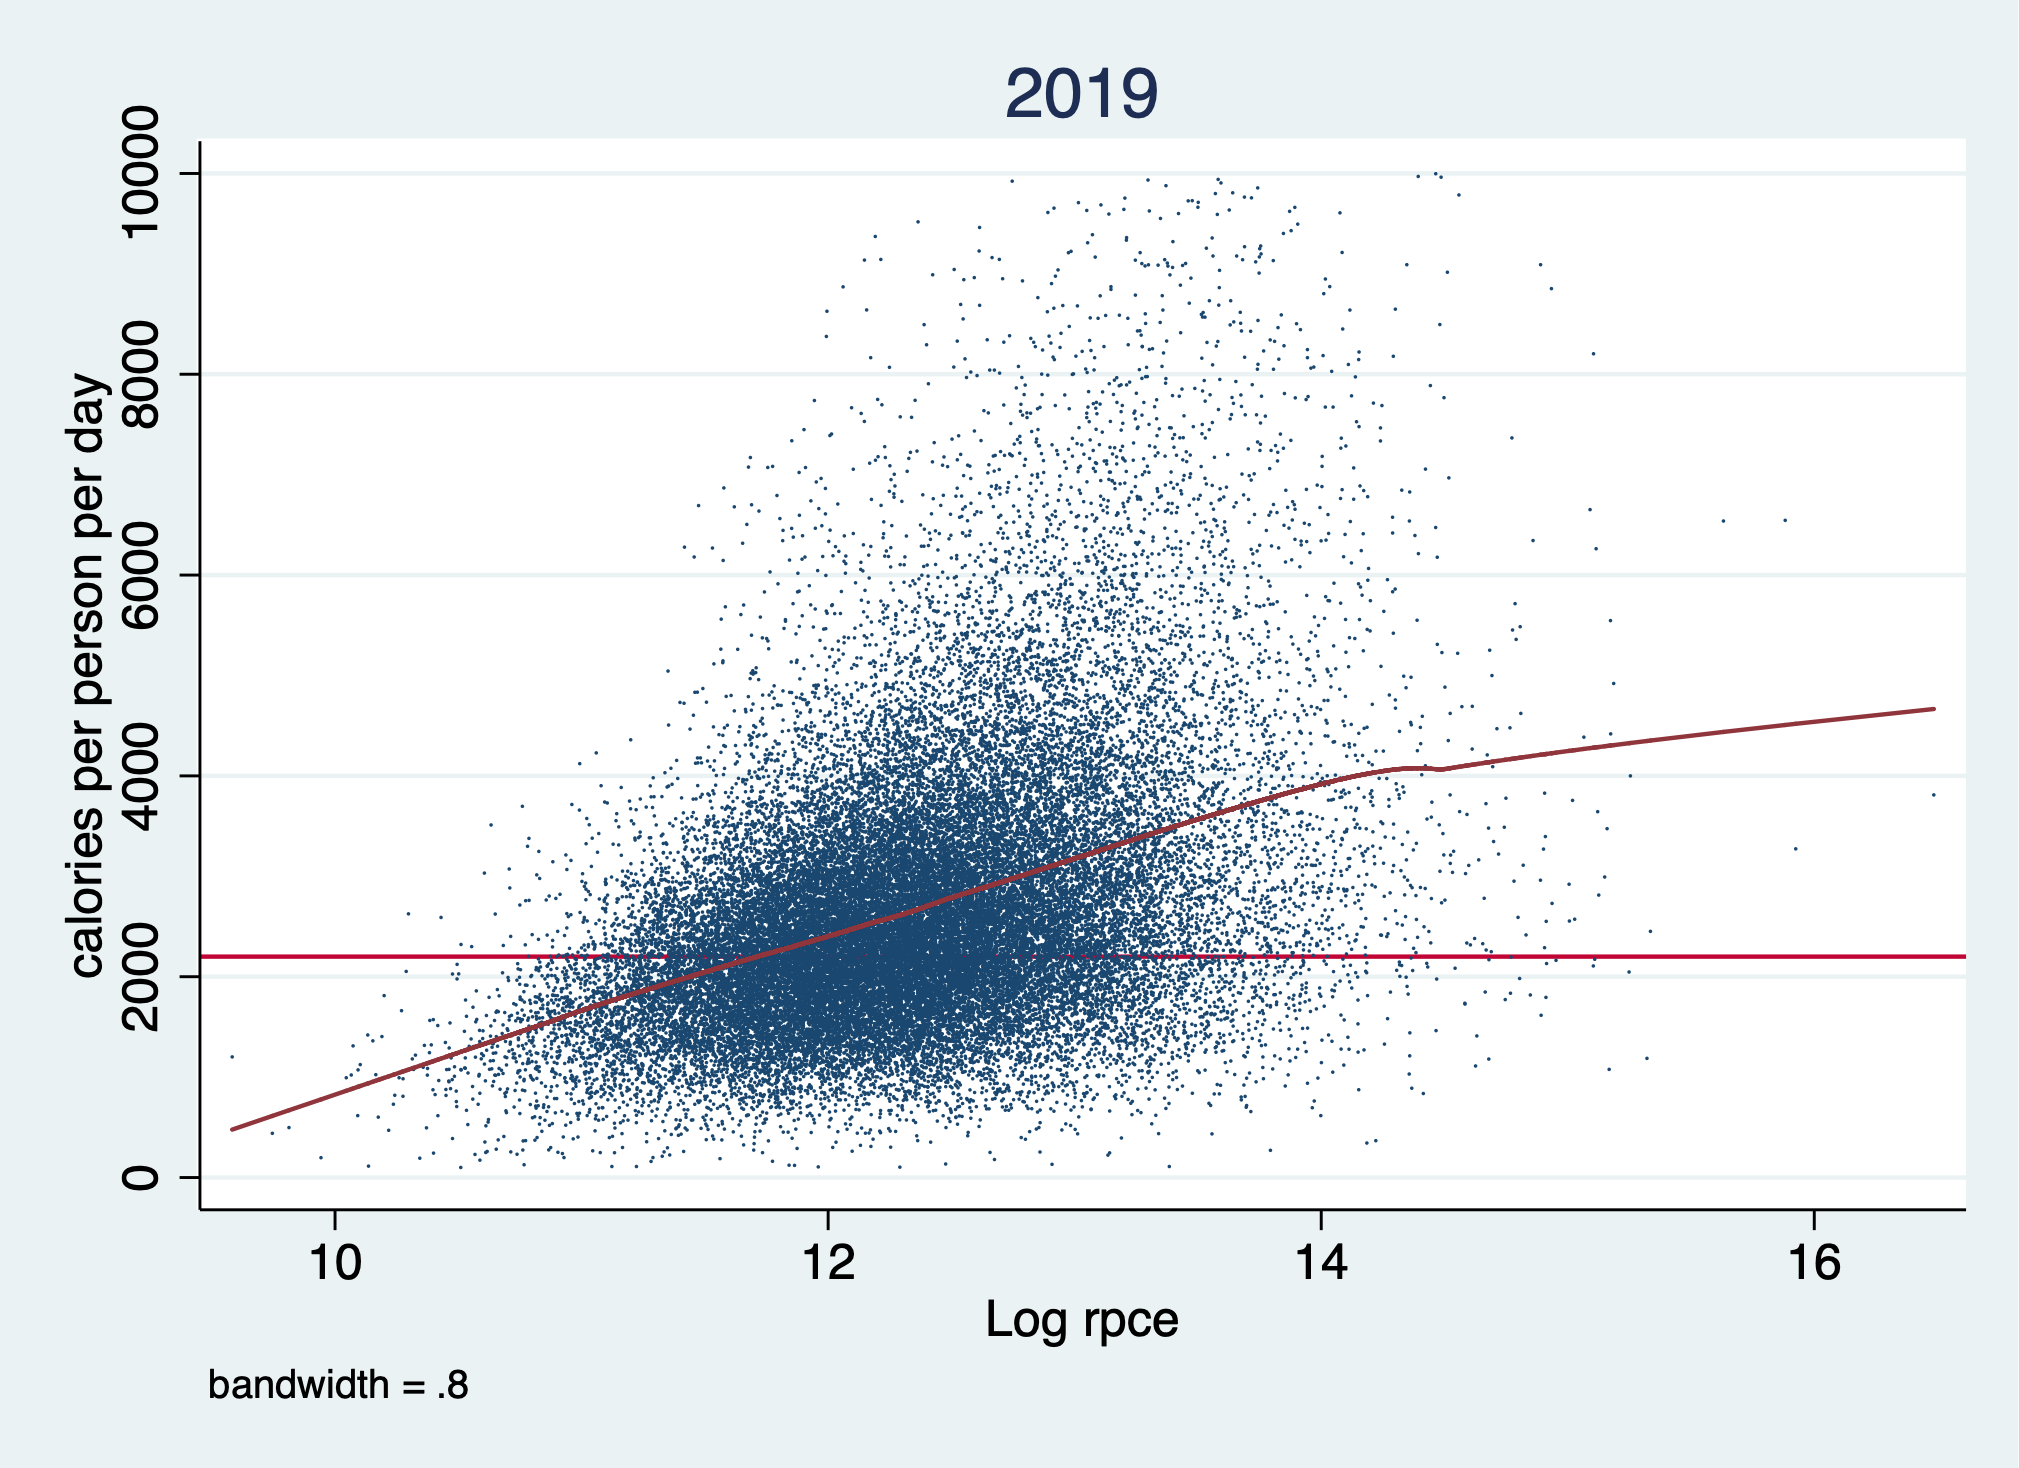
Another criticism of the Ministry’s report is that it estimates separate poverty lines for different years, a practice that introduces unnecessary errors into poverty estimates. This is because each estimate is based on an imprecise calorie calculation. Poverty lines measure the cost of living for an individual who needs 2100 calories per day. But the relation between calorie and income (or expenditures) is quite noisy, as this scatter graph for 2019 (1398) shows. The horizontal red line is the 2100 calories and the upward sloping red line is the non-parametric (lowess) estimates of the relationship between log real per capita expenditures and calories consumed. Just looking at the estimated relationship without the scatter plot creates the false impression that we know what level of expenditures is necessary to buy 2100 calories, whereas in reality there are many levels. The expenditures represented by the intersection of the two red lines, are associated with widely varying levels of calories (data from the expenditure survey of SCI, HEIS 2019).
While this may not be a serious problem for the poverty line measured for a single year, it is a problem if you are trying to compare poverty between two years. If each line is imprecisely estimated, chances are that we mistake a decrease in poverty for an increase. Some studies that claim poverty rose after the 2010 cash transfer program commit this type of error (see, for example, Table 8.2, p. 209, in this book).
To avoid this problem, researchers often prefer keeping the poverty line, however estimated, constant in real terms and compare it with expenditure values, also in real terms. This method has its problems, of course because it relies heavily on the ability of the CPI to capture accurately changes in the cost of living from one year to the next, something that is not guaranteed if the basket of goods on which the CPI is based differs from the basket that the poor consume. Iran’s statistical center calculates separate CPIs for ten deciles of income, which can help reduce bias, but such CPIs are not available for all the years I report here.
Difficulties in pinpointing an accurate threshold for poverty do not justify the massive confusion that currently pervades the poverty debate in Iran, for the range of poverty rates are far more than the gap caused by inaccurate estimation of the income-calorie relationship. Iranian activists and politicians use poverty rates as political football. For example, a prominent Iranian politician was recently reported to have said that the “official poverty line includes 70 percent of the society.” To be clear, Iran does not have an official poverty line, nor does the line estimated by officials in the Ministry of Labor cover 70 percent of Iranians.


[…] https://djavadsalehi.com/2022/12/31/iran-poverty-rates-updated/ […]
All things aside, do you really belive that 1$=4000 Toman in PPP terms?
Which basket of goods is considered?
From intuition, only the renting or buying a house is done by at least 1$=50000 Toman.
Would you please refer to a detailed report for deriving 1 $ PPP=4000 Toman in Iran?
Thanks for your question. First, 40000 rials is for the year 1400, not today. Secondly, I do not do the calculations of the PPP rate, the World Bank does. The principle is to compare all prices not just those in a particular person’s basket. To understand the principle behind the PPP, think if you can buy the same in the US with $1 as you can in Iran with 500,000 rials. Then think of bread, subway ride, gasoline, and lots of other things that are quite a bit cheaper than. I agree that some goods are even more expensive in Iran than in the US.