Long term trends in poverty and inequality in Iran
In my last post I argued that, after two years of improvement, poverty and inequality were on the rise in 2014/15. In this post I extend the calculation of poverty and inequality measures to the entire period for which survey data are available, 1984/85-2014/15. This post also updates the results in my 2009 paper published in the Journal of Economic Inequality, which covered the period from before the revolution to 2005.
The main message of the latter study was threefold: (1) poverty and inequality were high before the revolution; (2) poverty fell and remained low after the revolution; and (3) while inequality fell substantially after the revolution, it stayed fairly high for most of the post-revolution period. There was also some indication that inequality rose and fell with oil income. The recalculations here using different poverty lines does not change those conclusions, only updates them to the eventful years of the Ahmadinejad administration with high oil income and later the international sanctions.
First, a quick note about methodology. My welfare measure is gross household expenditures per capita (using net expenditures or income does not change any of the trends). I weight the observations by the sampling weights as well as by household size (to do the calculations in terms of individuals instead of households). The poverty line I use is from an earlier study and was calculated for 2005 using 60 distinct lines, one each for 30 provinces by rural and urban. (The 31st province of Alborz that was added after 2005 has been given the poverty lines for the Tehran province out of which it was created.) These poverty lines and the expenditure data were brought to 2014/15 prices using the Consumer Price index published for rural and urban areas by the Statistical Center of Iran (SCI). In the Appendix at the end of this post I provide the table of the 62 poverty lines used.

Poverty rates, 1984-2014 (percent below $5 per person per day poverty line)
A few interesting observations from the graph of poverty rates for the country as a whole: Poverty rates, which were in excess of 30% before the revolution at the height of the 1970s oil boom (see my 2009 paper), fell significantly after the revolution, to below 20%, only to rise again following the collapse of oil income in 1985 and the general destruction caused by the war with Iraq. Serious improvement in poverty did not come until long after the war had ended in 1988 and reconstruction had started to bear fruit. In the last decade of the 20th century, besides economic growth that followed rising oil prices, government policies that improved health and education in rural areas probably made the biggest difference to poverty rates.
Also noteworthy is the significant decline in poverty rates to below 5% during 2011-2013, when inflation raged and international sanctions started to choke the economy. How could poverty fall while the economy was tanking? Cash transfers is the obvious answer. Significantly, poverty increased in 2014, the first year of the Rouhani administration, when the economy grew by about 3%, but growth was apparently not pro-poor.
I portray the trends in inequality using two different measures. One, is the familiar Gini index, which shows a remarkable stability in the 45% range, before starting to decline in 2006, the period when Ahmadinejad’s redistributing policies were taking effect. In 2012/13 and 2013/14, it was 37.4%, rising to 38.8% in 2014/15 in tandem with poverty.
A second measure, the General Entropy index with parameter value of 2, GE(2), which is extra sensitive to changes in income in the top range (Gini is more sensitive to the middle income range), falls even more sharply after 2006. This index picks up the inequality increasing effects of two oil price hikes, in 1990-91 and 2000-01, indicating slow trickling down of rising oil revenues to lower income people.

The decline and reversal in inequality in recent years is also reported in a recent SCI publication (link in Persian). The news of rising inequality has been dismissed by the Tehran business press, in Tejarat Farda (noted in my previous post), and in Donyaye Eghtesad (link in Persian) as a delayed outcome of Ahmadinejad policies!
Appendix: Poverty lines
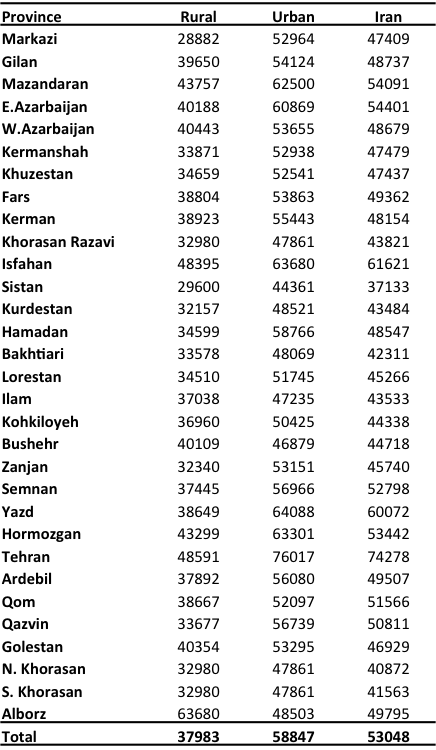
Poverty lines in 2014 rials per person per day
The average poverty line for the country as a whole in 2014/15 is 53,048 rials, which is about $5 in Purchasing Parity Power (PPP) per person per day. The highest poverty line is in urban Tehran (71,800 rials), which is more than twice the lowest poverty line of 28,882 rials in nearly rural Markazi province (rural Sistan is a close second from the bottom, with 29,600 rials).


Thanks for yet another thought-provoking analysis. A tiny thing: in the final sentence of the fourth paragraph – should it be “final decade of 20th C”?
Thanks for noting the error. I finally got to make the change.
Emphasizing Hamed’s point, it would be interesting to recalculate these poverty lines with a higher PPP, say 10$, and see whether the results indeed do not show a concentration of household incomes around a just-above-poverty level.
$10 per person per day is a very high poverty line, usually used to define middle class status. However, the CDF’s for income and expenditures do no cross except for the last two years (1392 and 1393), so no matter where you place the poverty line you get the same result in terms of change in poverty. For the last two years a higher poverty line (i believe over $10) would reverse the result of rising poverty in 1393.
I am not an ecnonmist and my comment is intuitive. The absent figure in analyses I believe is the “amount” of income/spending. When “inequality” is discussed there is just comparison between different people (not how much they earn and spend) and poverty only considers a minimum wage.
Okay, after revolution and during Ahmadinejad administration poverty and inequality fell; however, how much has the income of different deciles changed?
I mean inequality may fall but all become poor. Or the 1-2 low-income deciles may have have been better off, but what has happened to other deciles?
Because of rising oil income during 1999-2010 all incomes increased in those years. Incomes fell at the top when sanctions tightened and oil prices fell. People in the bottom two deciles did not experience a decline thanks to cash transfers.