Rethinking CPI, Food Prices, and Living Standards in Iran
A comment from an informed reader prompted me to re-examine my earlier post on living standards in 2024/25. The issue raised was whether it is adequate—or even accurate—to deflate household expenditures with the overall CPI, as reported by the Statistical Center of Iran (SCI), while ignoring the fact that food prices have risen faster than average prices.
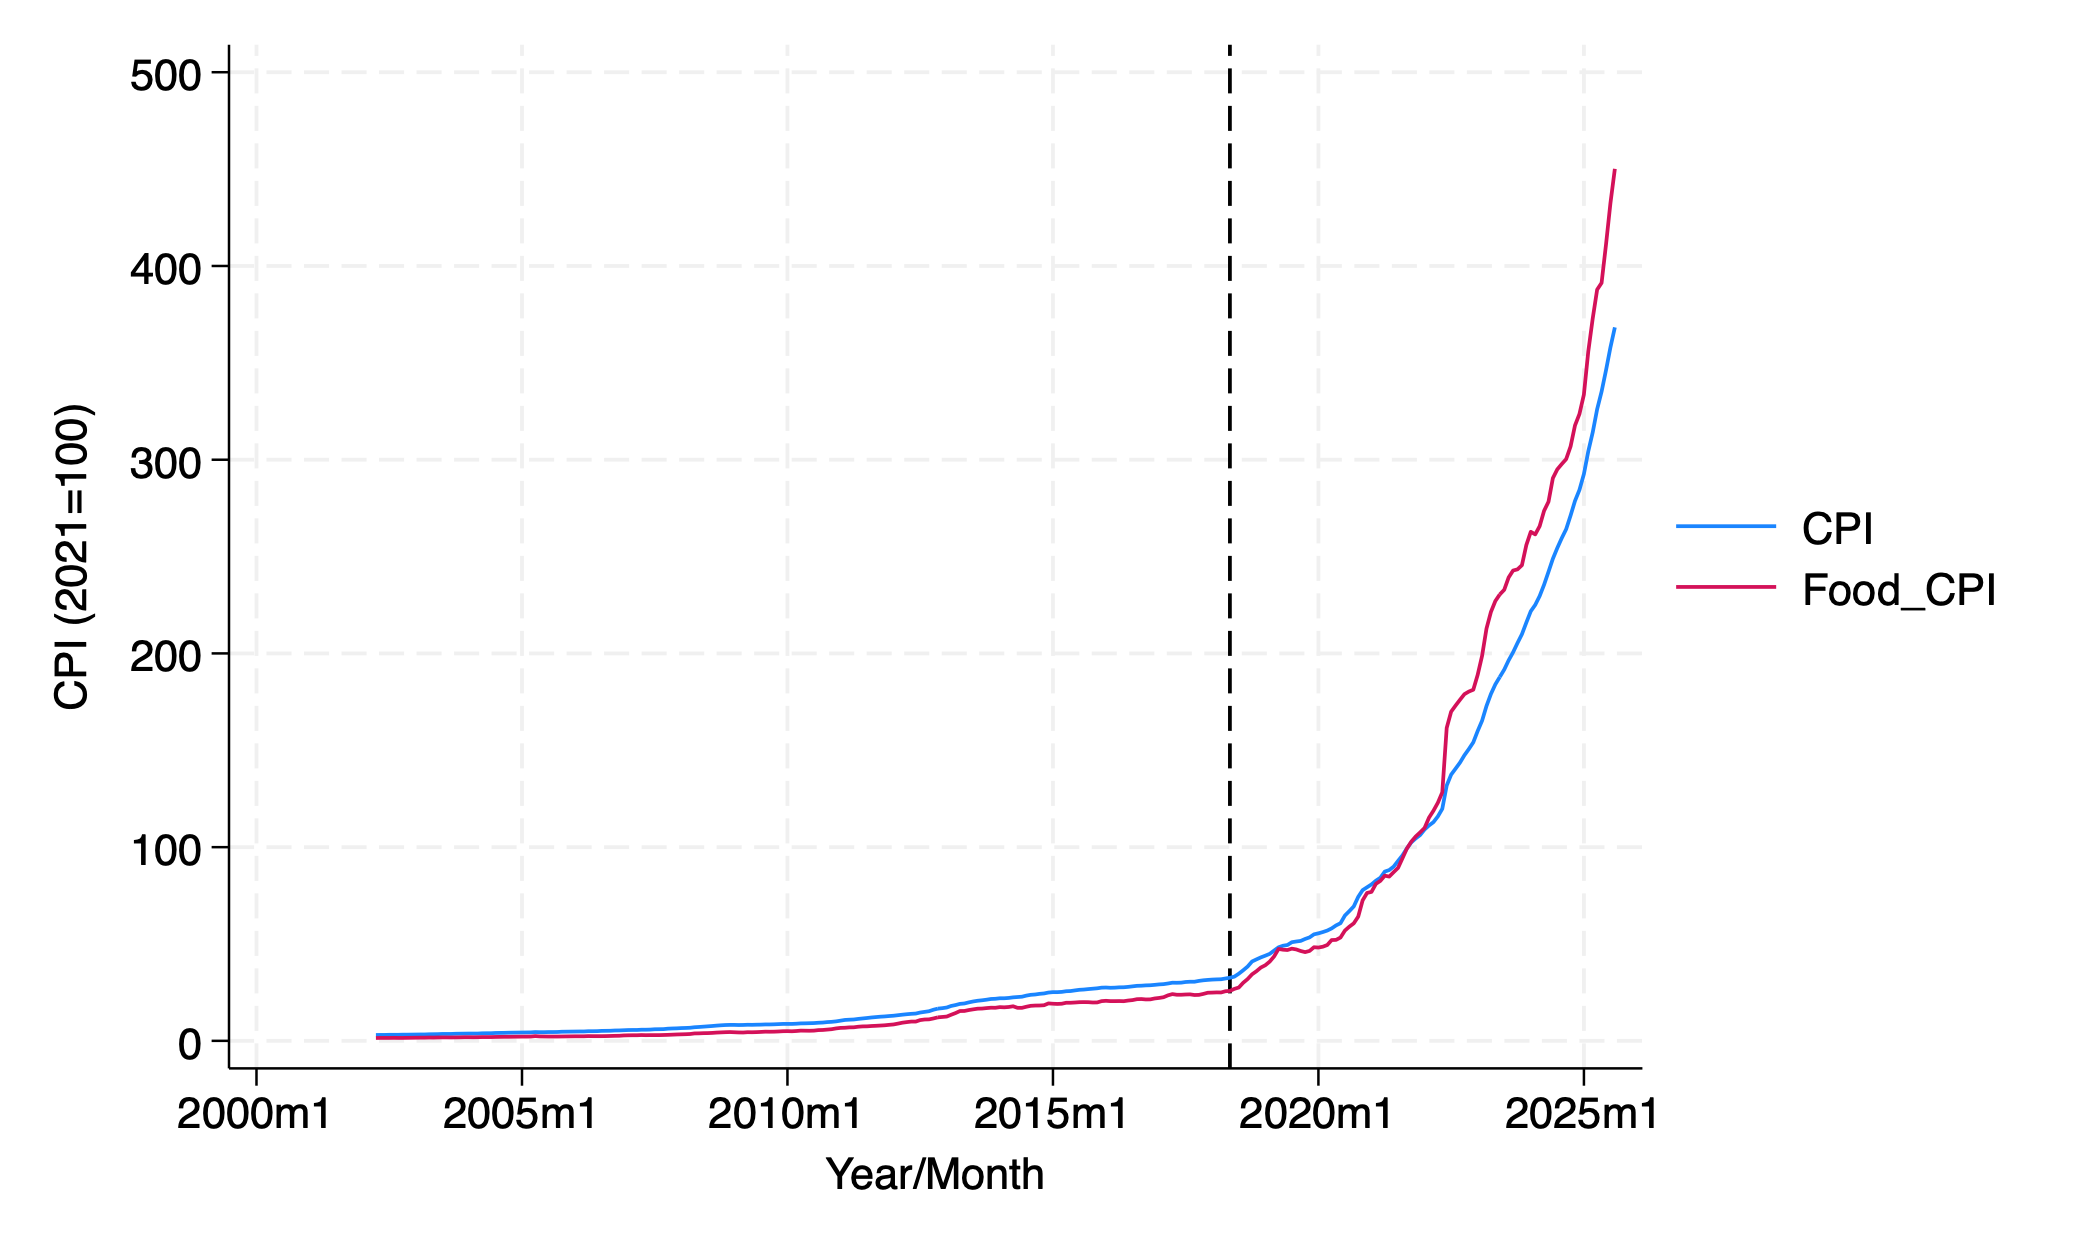
As shown in Figure 1, food CPI tracked the overall CPI until 2010 9before sanction tightened), fell below it until 2018 (Trump withdrawal from the JCPOA marked by the vertical line), but has since risen more quickly. The divergence became especially sharp in spring 2022, when President Raisi eliminated the preferential exchange rate for essential goods. For those who had argued that the subsidy’s benefits were captured entirely by rentiers, the subsequent surge in food prices is an important corrective: the subsidy had been suppressing consumer food prices, and its removal caused a sharp increase in food prices. However, as I argued at the time, the simultaneous increase in cash transfers prevented poverty from rising. Furthermore, as the Figure 2 in my last post shows, poverty actually fell, a finding that the revised data below confirms (see Figure 3).
Unsurprisingly, real food consumption fell sharply in response to rising food prices. According to Figure 2, real per capita food consumption (food expenditures deflated by the food CPI) was down by two-thirds in 2024 compared to 2004.
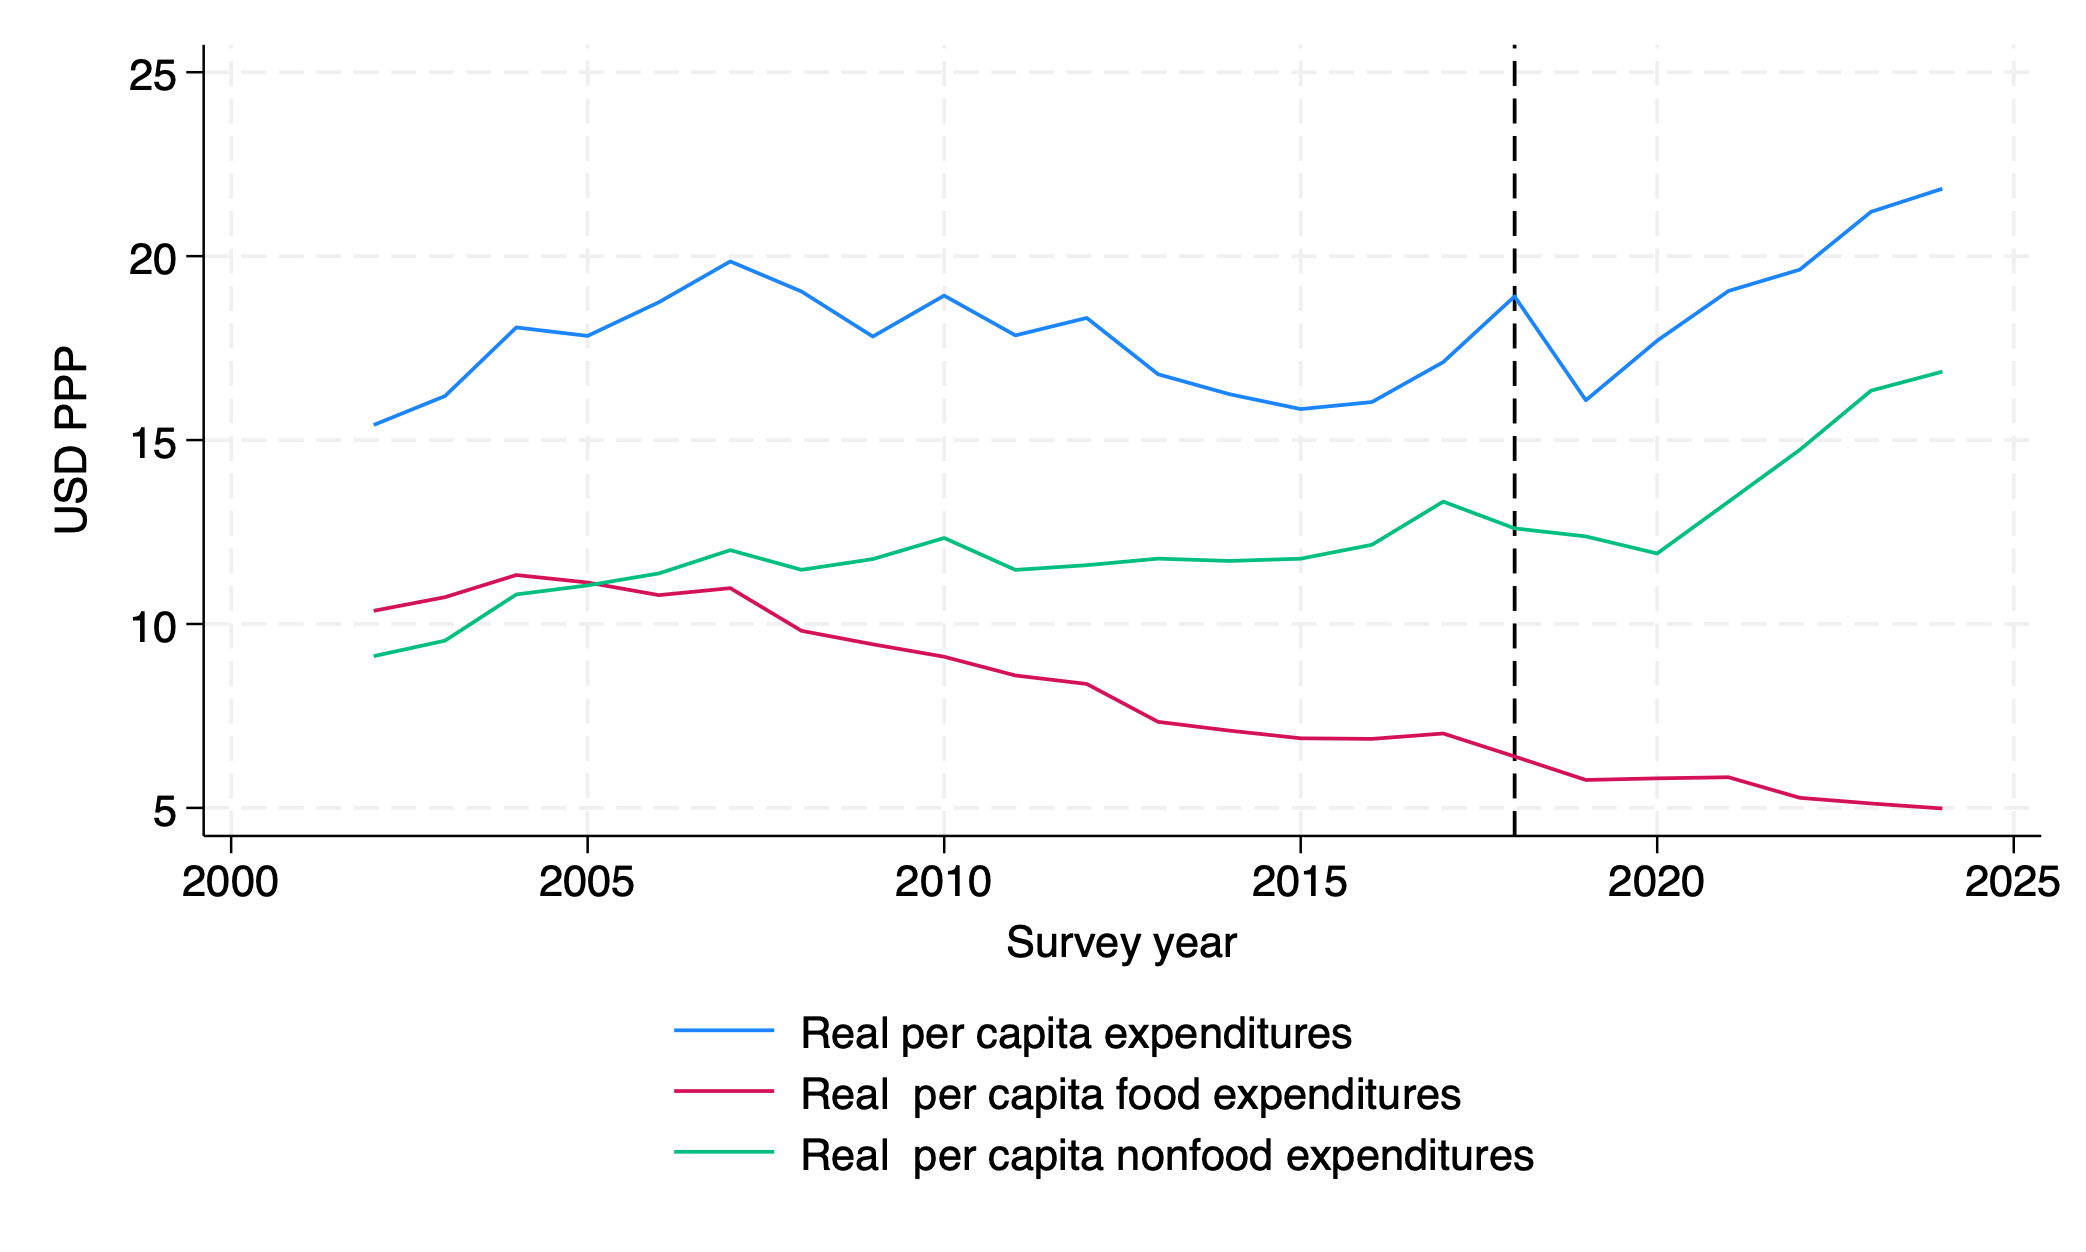
Figure 2. Real food and nonfood expenditures pre capita. Nominal expenditures are deflated by the food and nonfood CPIs, respectively. Real total expenditures per capita (blue line) are their sum.
The approach of deflating food and nonfood expenditures separately by their respective CPIs is an improvement over using the aggregate CPI, but it is not a complete fix. The overall CPI does capture faster food inflation, but only in proportion to food’s fixed weight in the base-year consumption basket. When food’s relative importance changes—as it clearly has in Iran—the aggregate CPI fails to reflect the full welfare impact of those price shifts. This is the essence of the index number problem. A more refined approach would deflate multiple subcategories of food and nonfood items by their own price indices, though that would take us beyond the scope of this post.
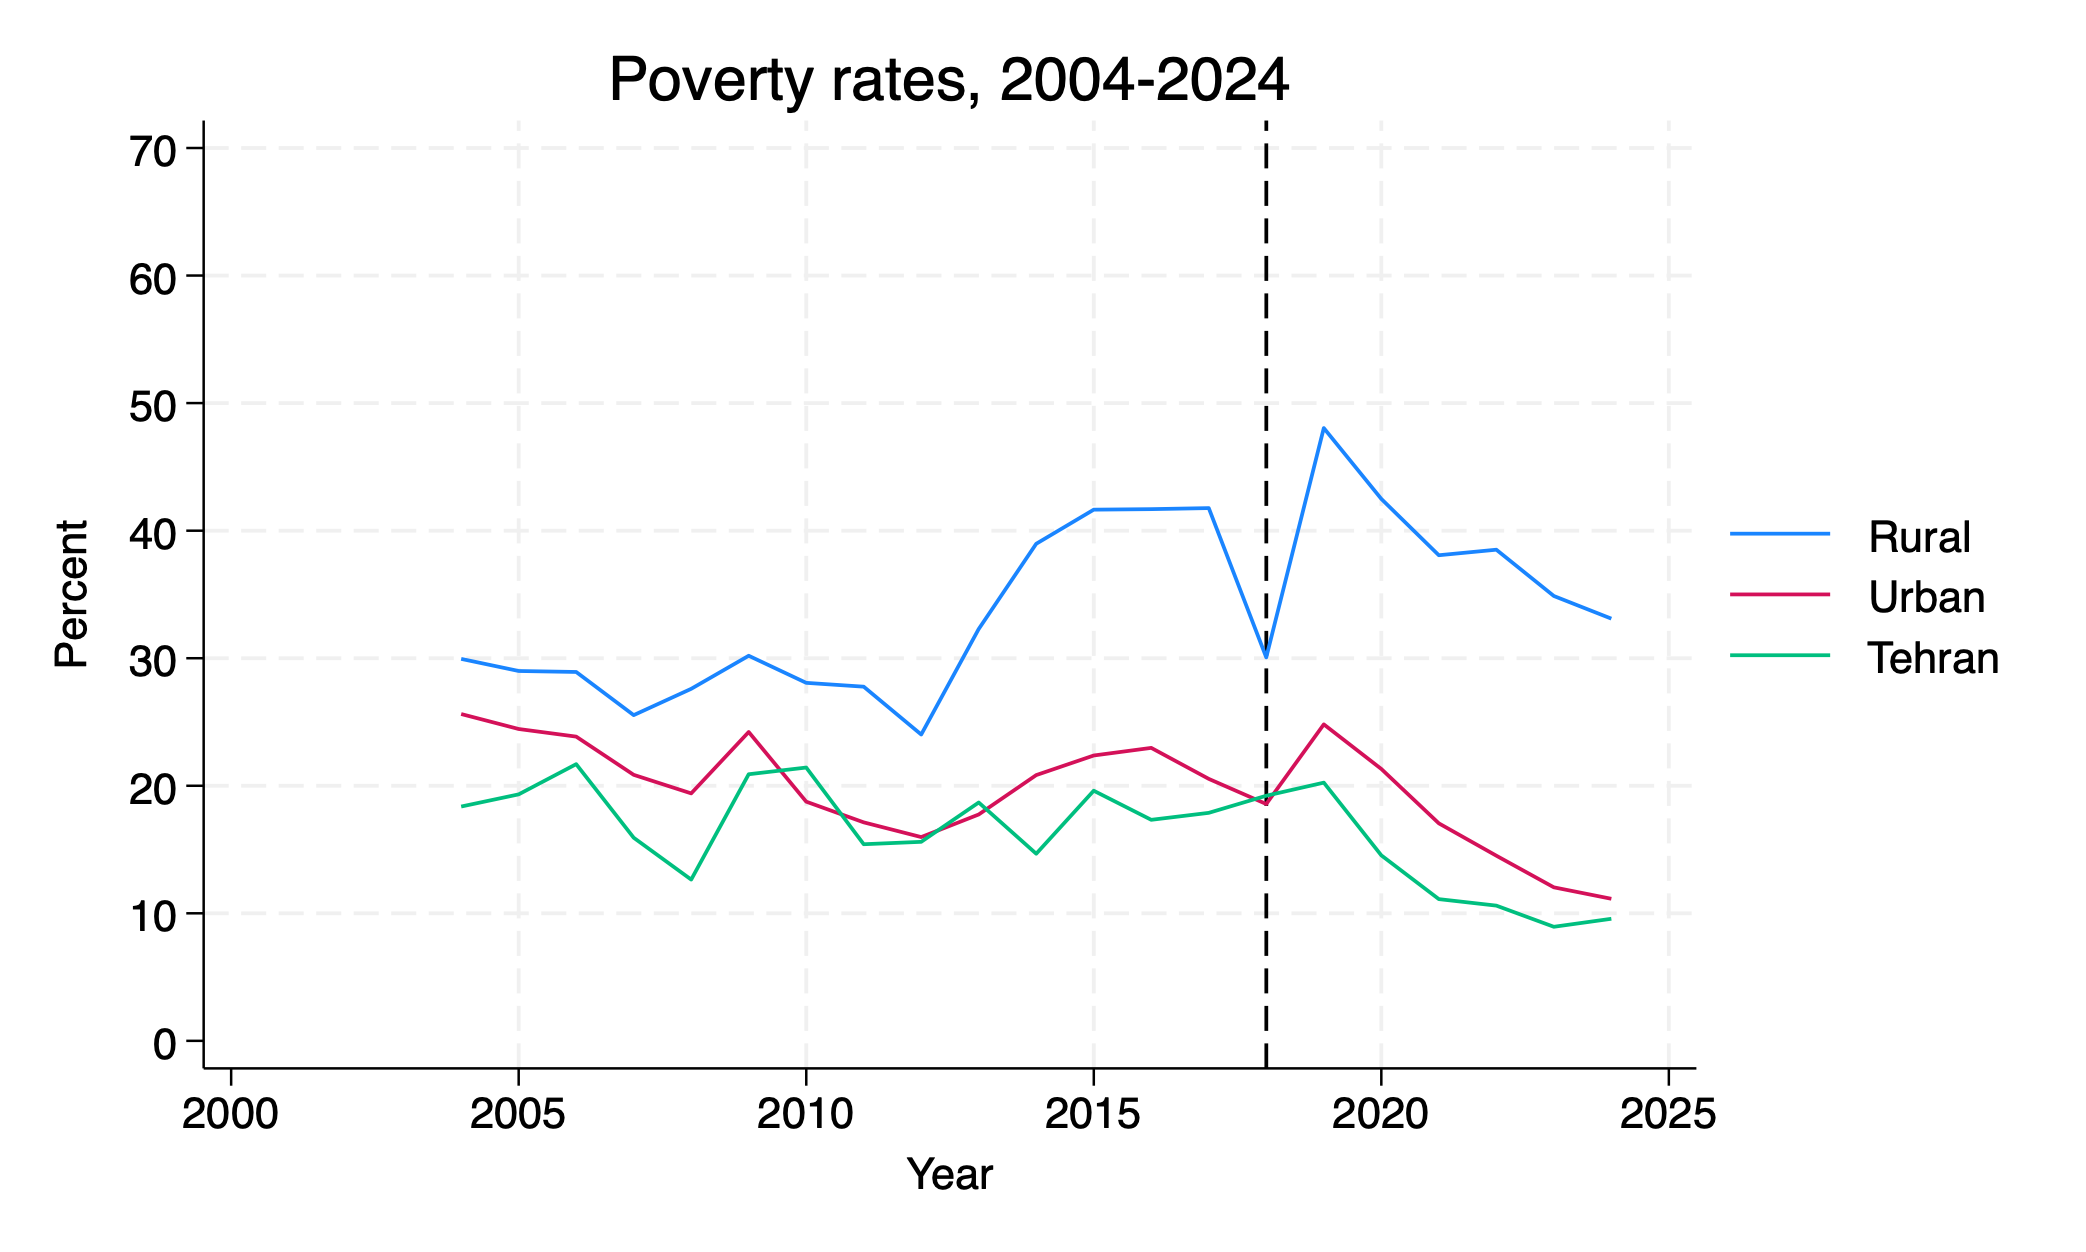
To complete the revision, in Figure 3, I show the revised poverty rates. The trends are unchanged: rising poverty before 2020 and decline in recent years. The calculation of the poverty line is as before but the real expenditures are slightly lower. The overall poverty rate is 15.9%, with a huge gap between rural (33.1%) and urban Tehran (9.6%). Recall the poverty line I use is about $7.7 USD PPP or 878,000 rials per person per day, which is roughly one-tenth of the unskilled wage in government projects as reported by SCI for fall 2024 (7,624,000 rials, assuming 8 hours per day), which may have to sustains a family of four.
Two additional points are worth noting. First, the rate of decline in real food consumption has remained remarkably steady, even though food prices accelerated after 2022. The likely explanation lies in the expansion of cash transfers. Judging by the sharp rise in real nonfood expenditures, these transfers appear to have been spent disproportionately on nonfood goods and services rather than on food.
Second, the use of the food share as a measure of household welfare—an idea I relied on in my earlier post—requires an important caveat. Historically, the share of food in total expenditures has fallen with economic development, a pattern so regular that it is known as Engel’s Law, supported by strong empirical evidence that the income elasticity of food is low. However, this relationship holds only when real food expenditures per capita are stable or rising (Subramanian and Deaton 1996). When real food spending declines, the falling food share no longer signals prosperity but rather constrained substitution away from essentials. Another indication that the food share has lost its welfare significance is when nutritional outcomes deteriorate, as they have in Iran over the past two decades.
Taken together, these results suggest that while average real expenditures have risen since 2018, the composition of consumption has shifted in ways that blunt the welfare gains. Rising nonfood spending has masked a persistent erosion of real food consumption and nutrition. In such an environment, aggregate indicators based on the overall CPI or total expenditures may overstate improvements in living standards. A fuller welfare picture requires attention to the changing structure of consumption—and to the uneven burden of inflation that higher food prices place on poorer households.


Hello Mr. Salehi, I had a request from you, considering that you also travel to Iran and live in the United States. I wanted to know how far I am from an American in terms of facilities and quality in Iran. More clearly, an American has a list of food, welfare, and energy expenses during the month. Considering that list and my lifestyle, how far I am from an American? How much difference do you feel when you come to Iran? I ask you this because many times Iranians who have emigrated talk about much better living conditions. I tell them to take a list of all the expenses they make in a month so that I can see how miserable I should feel. 100%, 90%… or 20%. For how many percent difference do we have here? We discuss misery and misery every day. I apologize for the long time. If you can give real examples,