Household Survey Data Reveal Modest Gains in Iran’s Living Standards for 2024/2025
The recently released microdata from Iran’s Household Expenditures and Income Survey (HEIS) offers valuable insights into household economic conditions across the country during the Iranian year ending on 20 March 2025 (Iranian year 1403 or 2024 for short). This post updates my earlier post on Iranian living standards in 2023.
Let’s begin with real per capita expenditures (rpce) over the past four decades, shown in Figure 1. My focus here is on the most recent years. The upward trend I noted in my previous post continued in 2024, with one exception: urban households in Tehran province, whose average rpce fell by 2.4%. In contrast, average consumption rose modestly in rural areas (0.9%) and more strongly in other urban areas (3.4%).
To many who get their news from social media, even these modest improvements may seem far from the “plain every day reality” according to which “the people’s maeeshat (living standard) worsens by the day.” The only elements of that bleak narrative that ring true are prices, which climb every month, and expectations for the future, which have grown more grim in the past year, especially since the Israel-US attacks in June, which have raised fears of more attacks.
But the survey data carry additional weight. They have been collected for decades and are shared publicly in minute detail—hardly the practice of an institution intent on manipulation. Moreover, they broadly align with the national accounts. As I explained in my update on the economy for 2024, GDP grew by 3.0% last year, and non-oil GDP—which more closely tracks private consumption measured by the survey—grew more slowly, by 2.1%. The difference comes from the oil and gas sector, which expanded by 6.1% and drove overall growth into positive territory. After adjusting for population growth of 0.7%, non-oil GDP per capita increased by just 1.4%—about as close as we can get to two independent measures of living standards pointing in the same direction.
Nothing in these reports of modest improvement from survey or national accounts data will change hardened views, but for those seeking a more accurate picture of the economy the graphs below can dispel the notion prevalent in more hawkish circles that Iran is on the verge of collapse — whether regime change or surrender — prompting threats, not diplomacy.

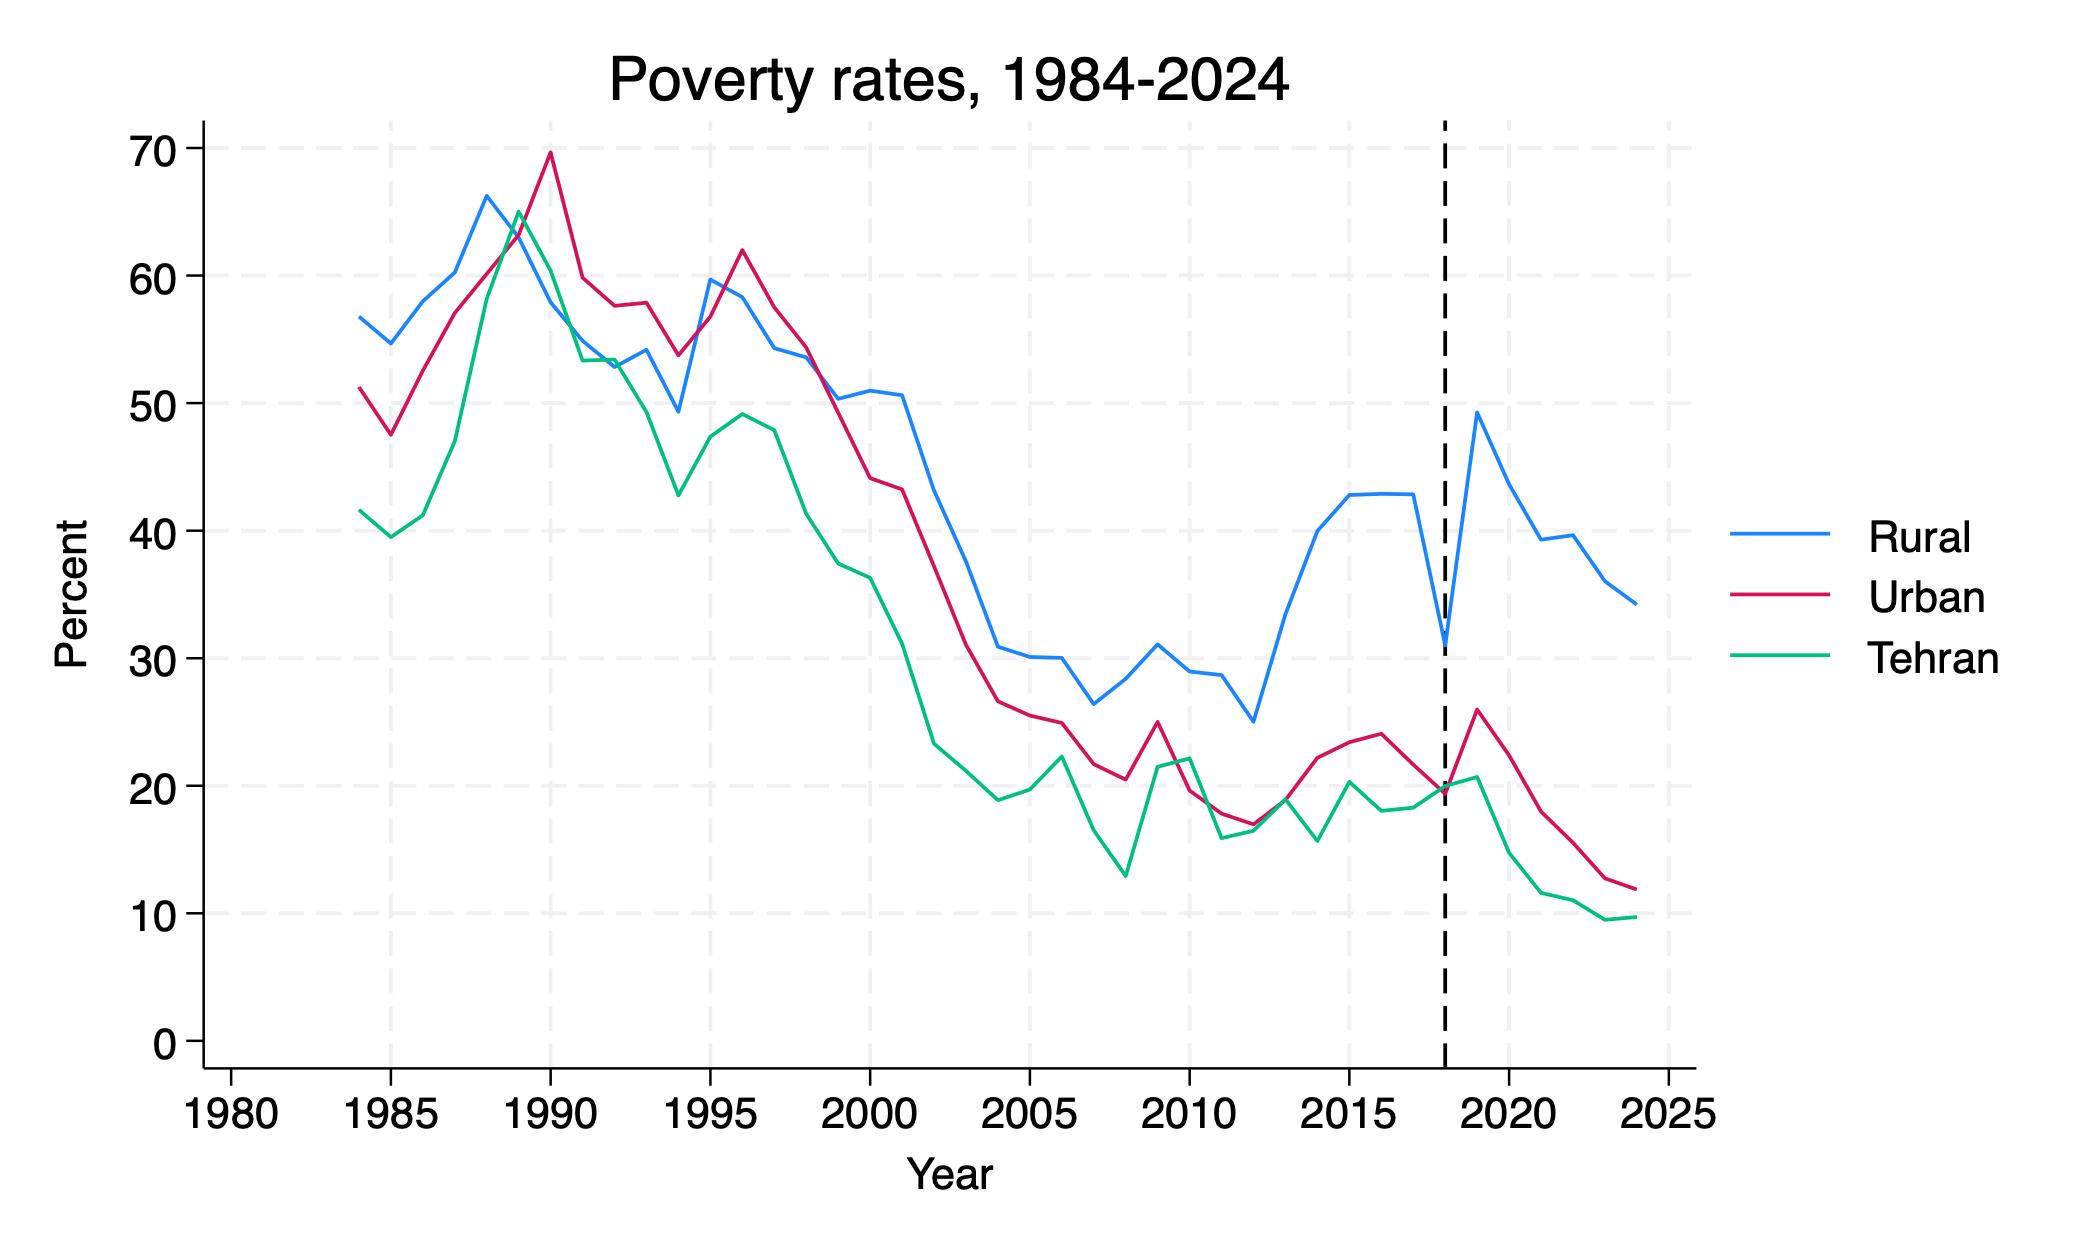
Rising averages have been pro-poor, in the sense that poverty has declined uniformly in the three regions. My poverty line is scaled to the World Bank standard for upper middle income countries (of which Iran is no longer a member), about $7.70 PPP per person per day, or 880,000 rials. This is less generous than what some official government documents have used in the past. Iran does not have an official poverty line. The poverty line I use varies by the rural and urban sectors of 31 provinces, but averages to $7.70 for Iran as a whole.
According to this poverty line, The poverty rate fell from 17.5% to 16.6%. This means nearly one million fewer people in poverty in 2024.
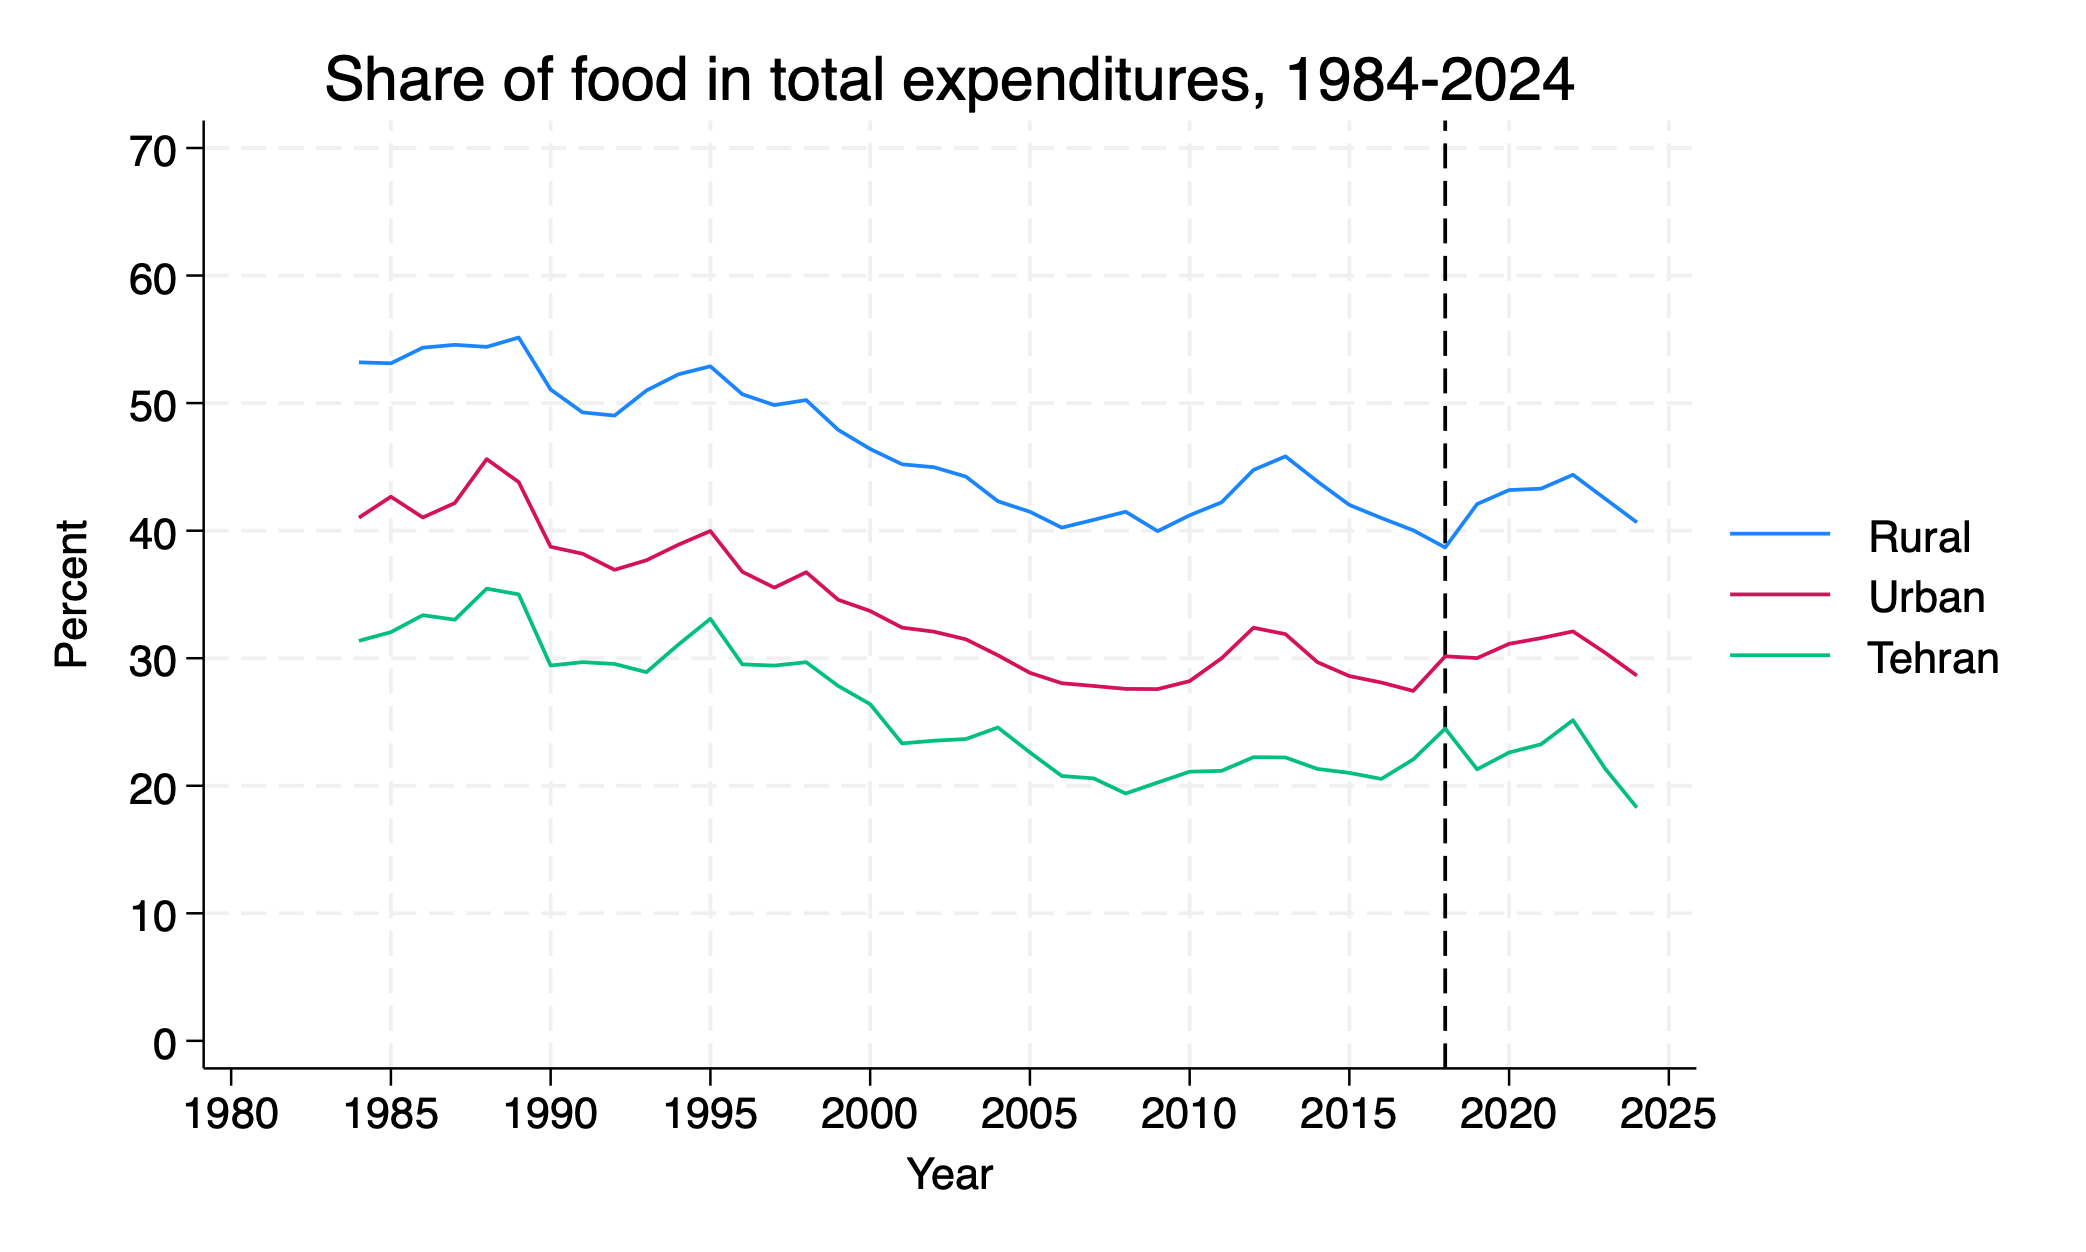
To confirm the trends in the poverty rate, I use below its reliable proxy, the share of food in total expenditures, which does not depend on the arbitrary definition of a poverty line. How much of a household’s budget is devoted to food is generally a good indicator of the household’s ability to meet its various needs, with a higher ratio suggesting more financial strain. In poor communities where this ratio exceeds 50%, families are spending a significant portion of their income on basic necessities, at the expense of other essential expenditures, like health and education.
As seen from Figure 3, in Iran this ratio peaked at about 45.9% in 1985, during the worst year of the Iran-Iraq war, but fell subsequently, mimicking the poverty rate in Figure 2. The difference between the two graphs after the 2018 Trump shock is interesting in that the increase in the share of food expenditure continues to rise until 2022, before falling in the last two years.
A quick look into how the recent modest growth has been shared is offered in Figure 4, which depicts average consumption growth by quintiles of per capita expenditures. Consistent with the regional distribution in which Tehran did poorly relative to other regions in terms of average rpce last year, the top 20% of households, most of whom reside in Tehran, did not experience any increase in real expenditures. The middle quintiles had faster increases than the top and bottom quintiles.
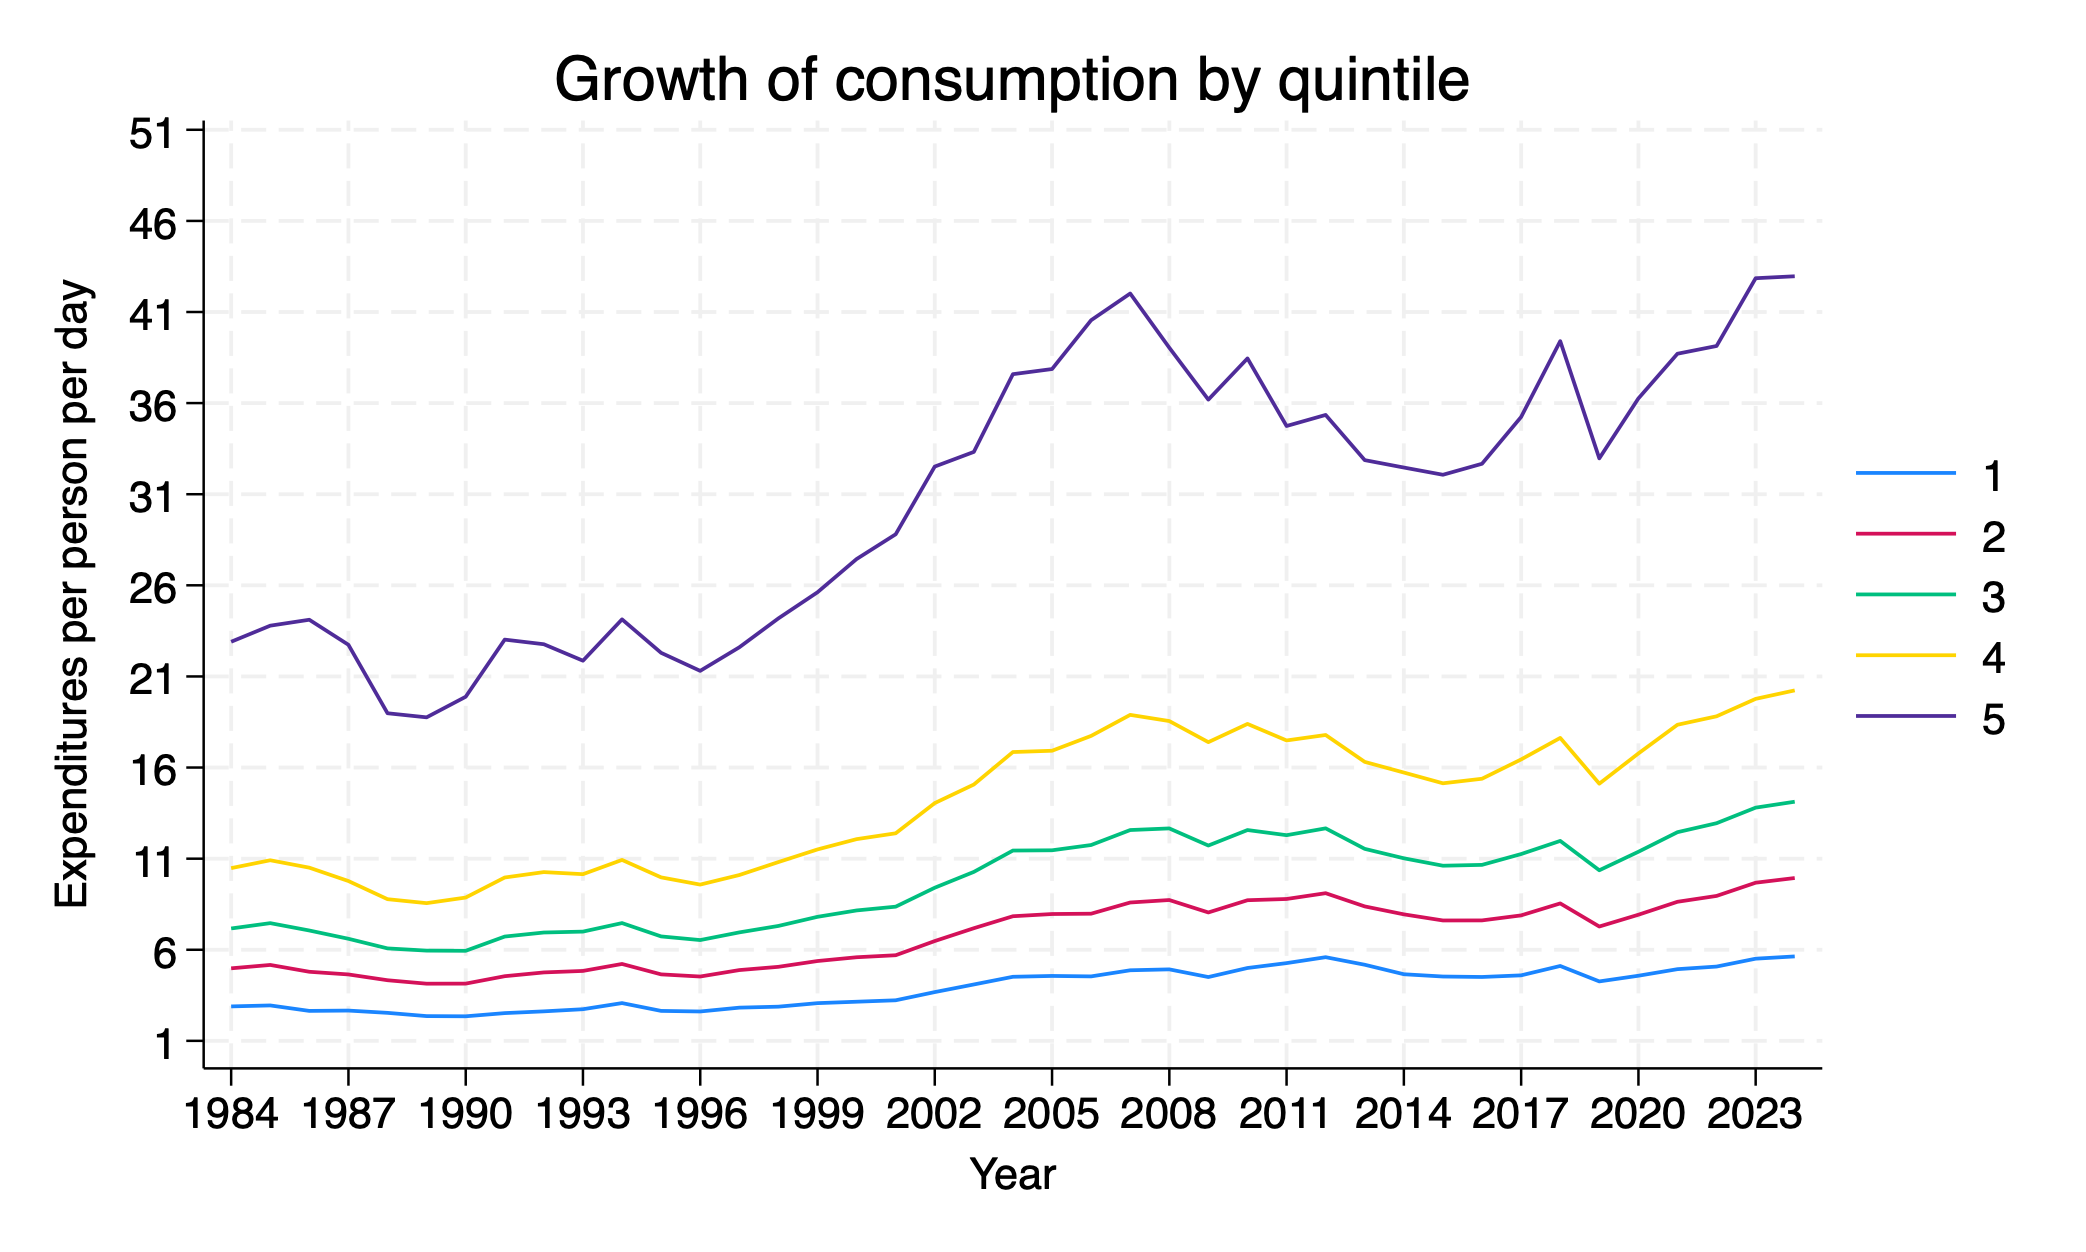
There is little doubt that this pattern is the result of distributive government policy; in particular, cash transfers, which increased sharply in 2023. Figure 5. shows the real values of cash transfers since 2011, when the survey collected data separately for monthly transfers started in 2010. Under president Ahmadinejad very generous transfers were financed in large part by higher energy prices. Average transfers increased in 2011 and 2012 as more households registered to receive the then universal transfers, but their real values fell drastically for the next 10 years, as their nominal amount remained fixed while prices soared. In 2023, under president Raisi, the program got a big boost, but this time only families identified in the bottom 70% were eligible, and no independent source of revenues was identified for it. In 2024, each individual received about 9,000,000 rials per month in cash transfers (about $1 PPP per day).
Postscript. Before leaving this subject, I should note how extraordinary it is for a country accused of secrecy and rogue behavior to publish its household survey data at the micro level after it has been attacked by two nuclear powers, during which its bureaucracy came under suspicion for not safeguarding critical national information. The contrast with four decades ago could not be starker. When I visited Tehran in 1988, just after the previous war had ended, only printed information was available. To purchase a copy of the Statistical Yearbook from the store of the Statistical Center of Iran, I had to present a letter of introduction from my university certifying my research intentions. Today, while a war with far stronger adversaries is merely paused, the same institution places microdata online for anyone to access.


Dear Dr. Salehi,
Thank you for your insightful recent note—like your other valuable work, I benefited greatly from it. It also prompted me to look deeper into a related issue.
In line with the very insightful point raised by Dr. Maljoo, there is an issue I would like to share with you and seek your guidance on. I have conducted a preliminary study based on the tenure status of households (owner, tenant, and others) from 2006 to 2024 (1385–1403), and I would like to share some of the results with you.
As discussed in your note, real per capita consumption (RPCE) has been increasing since 2021 (1400). Dr. Maljoo also hypothesized that this increase may be largely driven by the rising relative prices of items such as housing and healthcare.
My findings suggest that his hypothesis — particularly regarding housing — appears to be entirely correct, and the disaggregated data strongly supports it. The apparent rise in real consumption seems to be overwhelmingly overshadowed by the housing cost crisis. As a trade-off, households appear to have reduced their food consumption. The caloric intake indicator that I calculated clearly reveals this “forced substitution effect”:
1.Tenants: The share of housing in their total cash expenditures (Share_Housing_from_Cash) jumped from about 35% in 2006 to 44% in 2024. Meanwhile, their average daily caloric intake fell sharply by 28%, from 2,537 to 1,815 calories. This suggests that the overall decline in the food share you noted in Figure 3—at least for tenants—is not a sign of improved welfare, but rather reflects the necessity of sacrificing nutrition to afford housing.
2.Homeowners: Although this group did not face direct cash housing costs, they too experienced a substantial 34% reduction in caloric intake (from 3,163 to 2,083), indicating widespread pressure on nutritional welfare.
If this interpretation is correct, it may be concluded that despite the observed rise in real (inflation-adjusted) consumption, the actual level of welfare — as reflected in vital indicators such as caloric intake — has not improved since 2021. In fact, it appears to have declined, especially for the more vulnerable groups, notably tenants.
I would be deeply grateful for any guidance or insights you may kindly share on this matter.
With sincere respect and appreciation,
Masoud Farahani
Thank you for your comment. I have not looked at average caloric and protein intake for the past three years but the last time I looked, they exhibited a declining trend since 2005. I would love to see what the newer data says. I would not be surprised if food prices did more than what I noted when I deflated food consumption separately in my correction to the original post.
Get Outlook for Mac https://aka.ms/GetOutlookForMac
Dear Dr.Salehi
Enlightening post. I guess the targeted food coupons can explain why the share of food expenditure decreased last year. My friend working in the Ministry of Refah involved in implementing this program says they stopped top decile cash transfer and allocated that to conditional transfer for the low deciles. We would be honored to help you with more information and hopefully datasets for such valuable insights from your research.
Thank you of your comment and offer to help. I thought they eliminated the top 3 deciles.
You are right. Top deciles for correction. They plan to go further in targeting with new data sources being prepared for real state ownership so I expect more elimination.
سÙا٠٠اØتراÙ
جÙاب Ø¢ÙØ§Û Ø¯Ú©ØªØ± صاÙØÛ Ú¯Ø±Ø§Ù Û
از ÙÙشتÙâÛ Ø§Ø®Ûرتا٠â ÙÙ ÚÙ٠دÛگر آثار ارزش٠Ùدتا٠â بسÛار بÙر٠برد٠. در ÙÙ Û٠ز٠ÛÙÙ Ù ÙضÙØ¹Û Ùست ک٠٠اÛÙ٠با ش٠ا در Ù Ûا٠بگذار٠٠از راÙÙ٠اÛÛâÙØ§Û Ø´Ù Ø§ استÙاد٠کÙÙ .
Ù Ù ÙÙÙز ب٠دادÙâÙØ§Û Ø³Ø§Ù Û±Û´Û°Û³ Ø¯Ø³ØªØ±Ø³Û ÙداشتÙâØ§Ù Ø Ø§Ù Ø§ Ù¾ÚÙÙØ´Û Ø¯Ø±Ø¨Ø§Ø±ÙâÛ Ù ØµØ±Ù Ø®Ø§ÙÙارÙØ§Û Ø´ÙØ±Û Ù Ø±ÙستاÛÛ Ø¨Ø± اساس دادÙâÙØ§Û Ø³Ø§ÙâÙØ§Û Û±Û³Û¹Û¸ تا Û±Û´Û°Û² اÙجا٠دادÙâا٠ک٠٠اÛÙÙ ÙتاÛج اÙÙÛÙâÛ Ø¢Ù Ø±Ø§ با ش٠ا در Ù Ûا٠بگذار٠.
Ù٠اÙâØ·Ùر ک٠در اÛÙ ÙÙشت٠٠ÚÙد Ûادداشت Ù¾ÛØ´Û٠ش٠ا ÙÛز Ù Ø·Ø±Ø Ø´Ø¯Ù Ø§Ø³ØªØ Ù ØµØ±Ù Ø®Ø§ÙÙارÙا از سا٠۱۴۰۰ ر٠ب٠اÙزاÛØ´ بÙد٠است. استÙباط ٠٠از ÙتاÛج تØÙÛÙ Ø®Ùد٠اÛ٠است ک٠اÛ٠اÙزاÛØ´ بÙâØªÙ Ø§Ù Û ÙØ§Ø´Û Ø§Ø² اÙزاÛØ´ Ù Ûزا٠٠صر٠غÛرخÙراکÛâÙا ٠خصÙصا٠٠سک٠٠ÙÛز بÙداشت ٠در٠ا٠بÙد٠است (اØت٠اÙا٠بر اثر اÙزاÛØ´ ÙÛ٠ت ÙØ³Ø¨Û Ø§Û٠اÙÙا٠. ت٠ا٠اÙÙا٠با ÙÛ٠تâÙØ§Û Ø«Ø§Ø¨Øª سا٠۱۴۰۰ تعدÛ٠شدÙâاÙد). خاÙÙارÙØ§Ø Ø¯Ø± عÙØ¶Ø ÙاگزÛر شدÙâاÙد Ù ØµØ±Ù Ø¨Ø±Ø®Û Ø§Ø² اÙÙا٠غÛرخÙØ±Ø§Ú©Û Ù Ø¨ÙâÙÛÚ٠بسÛØ§Ø±Û Ø§Ø² اÙÙا٠خÙØ±Ø§Ú©Û Ø®Ùد را کاÙØ´ دÙÙد. اگر اÛ٠برداشت درست Ø¨Ø§Ø´Ø¯Ø Ù ÛâتÙا٠ÙتÛج٠گرÙت ک٠عÙÛâرغ٠اÙزاÛØ´ Ø³Ø·Ø Ù ØµØ±Ù ÙاÙØ¹Û (تÙر٠âزداÛÛâشدÙ)Ø Ø³Ø·Ø Ø±Ùا٠خاÙÙارÙا از سا٠۱۴۰۰ ب٠بعد اÙزاÛØ´ Ùداشت٠است. بسÛار سپاسگزار Ù ÛâØ´Ù٠اگر در اÛ٠ز٠ÛÙ٠راÙÙ٠اÛÛâتا٠را درÛغ ÙÙر٠اÛÛد.
Øاص٠اÛÙ Ù¾ÚÙÙØ´ را ÙÙÙز ÙÙÙشتÙâا٠. ا٠ا Ø¨Ø±Ø§Û Ø±ÙØ´Ùâتر شد٠تÙضÛØØ§ØªÙ Ø ÙاÛ٠پاÙرپÙÛÙØªÛ Ø±Ø§ ض٠Û٠٠کردÙâØ§Ù Ú©Ù Ø¨Ø±Ø®Û Ùکات اصÙÛ Ø±Ø§ تا ØØ¯Û Ùشا٠٠ÛâدÙد.
تÙضÛØÛ Ø¯Ø±Ø¨Ø§Ø±ÙâÛ ÙاÛ٠پاÙرپÙÛÙت:
ÛÚ©Ù . ÙÙØ· ٠ربÙØ· ب٠خاÙÙارÙØ§Û Ø´ÙØ±Û Ø§Ø³Øª Ù ÙتاÛج ٠ربÙØ· ب٠خاÙÙارÙØ§Û Ø±ÙستاÛÛ Ø¯Ø± Ø¢Ù ÙÛا٠د٠است.
دÙÙ . بÙا بر تعارÛÙÛ Ú©Ù Ø§Ø² طبÙات Ø§Ø¬ØªÙ Ø§Ø¹Û Ø¯Ø§Ø´ØªÙâا٠٠برآÙردÙاÛÛ Ú©Ù Ú©Ø±Ø¯ÙâØ§Ù Ø ÙÙØ· س٠طبÙÛ Ø§Ø¬ØªÙ Ø§Ø¹Û Ø±Ø§ در ÙاÛ٠آÙردÙâا٠ا٠ابÙÛÛ Ø¬Ù Ø¹Ûت ÙÛز تÙرÛبا٠رÙÙدÙØ§Û Ù Ø´Ø§Ø¨ÙÛ Ø±Ø§ داشتÙâاÙد.
سÙÙ . ٠صر٠دÙÚ©âÙØ§Û ÙزÛÙÙâØ§Û Ø±Ø§ ب٠زبا٠٠صر٠طبÙات Ø§Ø¬ØªÙ Ø§Ø¹Û ØªØ±Ø¬Ù Ù Ú©Ø±Ø¯ÙâØ§Ù Ø Ø§Ù Ø§ رÙØ´ اÛ٠کار در ÙاÛ٠تÙضÛØ Ø¯Ø§Ø¯Ù Ùشد٠است.
سÙÙ . اÙدازÙâÛ Ø·Ø¨Ùات Ø§Ø¬ØªÙ Ø§Ø¹Û ÙÛز بر اساس ÙتاÛج تÙصÛÙÛ Ø·Ø±Ø Ø¢Ù Ø§Ø±Ú¯ÛØ±Û ÙÛرÙÛ Ú©Ø§Ø± برآÙرد شد٠است.
با اØترا٠٠سپاس
Ù Ø٠د ٠اÙجÙ
Dear Mohammad,
Good to hear from you and thanks for reading my blog and your kind words. I had trouble reading your note because of the strange font, which AI fixed it for me!
You make a very good point regarding the potential bias in the real expenditure series. I should experiment with using different price indices, especially food. I hope to find the time to do that soon.
Best,
Djavad
Dear Dr. Salehi,
Thank you very much for your kind reply. If you have the chance to experiment with alternative price indices, I would be grateful if you could also keep in mind the following question and share your thoughts with me.
Why have real expenditures on housing as well as health care for all deciles risen sharply since 1399? Do you think this could be explained mainly by the rise in the relative prices of these two groups of non-food items?
Many thanks in advance for your insights.
Best regards,
Mohammad
Thanks for helping me explore this issue further. I could not see the PowerPoint you mentioned in your comment, but I take your word for it that changes in relative prices may have altered the composition of household expenditures to an extent that the CPI—based as it is on expenditure shares in 1400 (2021)—does not capture properly. What appears as an increase may in fact be a decline once these relative price changes are taken into account. At the first opportunity, I will also try experiment with real household expenditures using less aggregated price indices.
As to what explains the sharp increase in housing and health, I am not sure I have a good answer.