Iran’s Investment Puzzle: Diverging Data, Converging Concerns
In a recent post, I discussed the rising standard of living in recent years and questioned how that could persist while the share of investment in GDP has been falling. Not only has it been falling, but to levels that seem inadequate for maintaining the capital stock—and with it, the quality of essential services like electricity. This is clearly unsustainable. If investment drops below 10 to 15 percent of GDP, the country would essentially be consuming by running down its capital—much like a household that sustains itself by selling off its furniture.
So, I spent some time looking at various measures of the investment share. What I found raised more questions than it answered.
Even the data from the Statistical Center of Iran (SCI) do not tell a consistent story. The investment share I cited was calculated at prices fixed in the Iranian fiscal year 1400 (2021/2022). But using the current price series paints a different picture. This divergence isn’t entirely surprising, since the price indices for investment and GDP—the numerator and denominator of the investment share—can behave quite differently.
But just how different are they?
In Figure 1, which uses the fixed price series, the investment share appears to increase as sanctions tighten (marked by the dashed vertical line in 2011). In contrast, Figure 2, based on current prices, shows a declining trend. Both figures suggest that investment in recent years has hovered around 16 to 18 percent. Yet one of the puzzles in the data is the stark difference in the reported investment rates for the 2000s: below 15 percent in Figure 1, but above 20 percent in Figure 2.
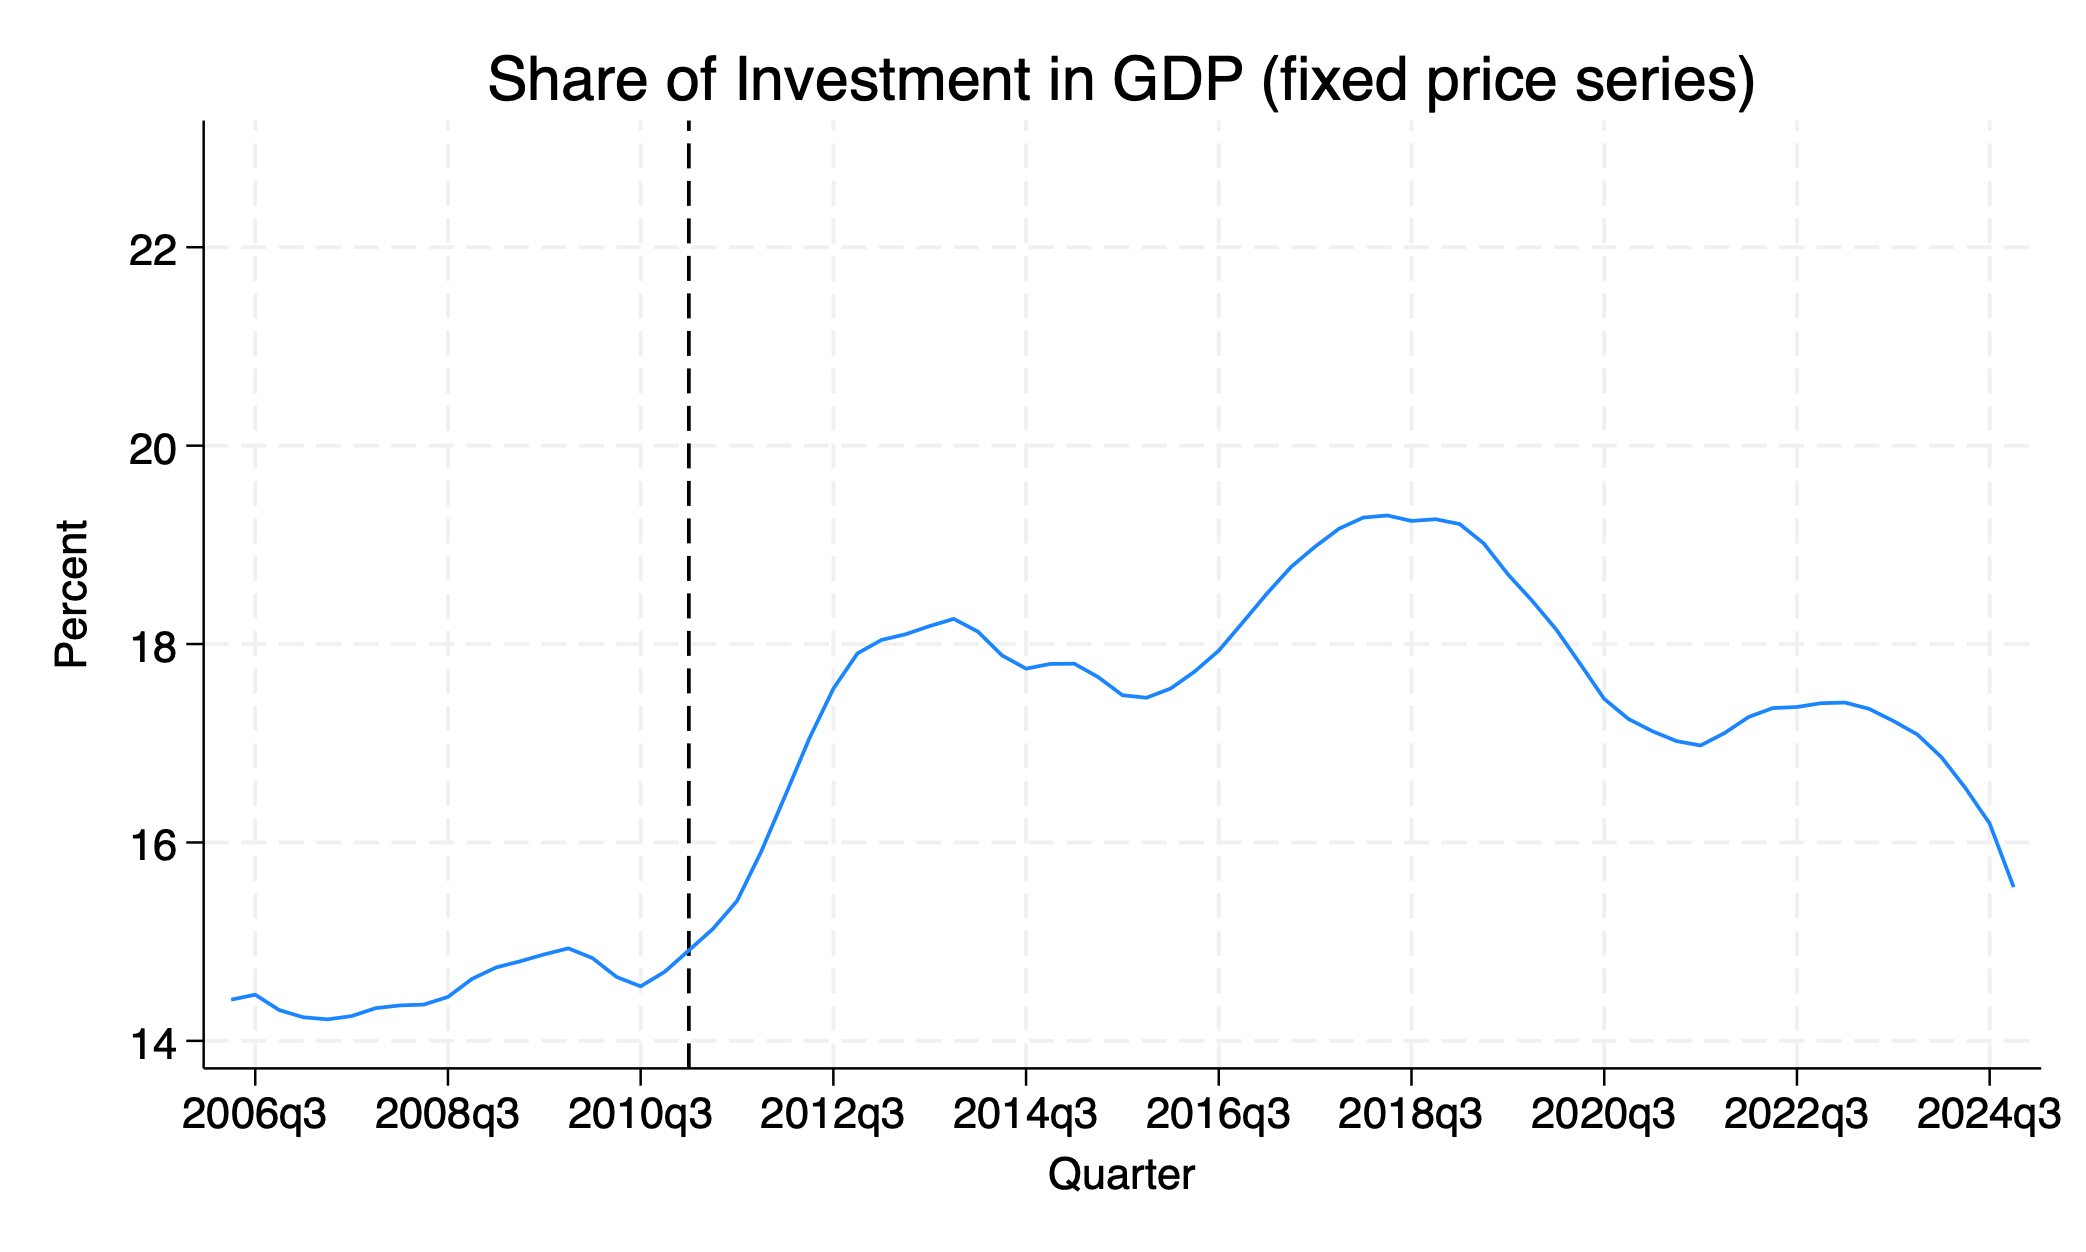
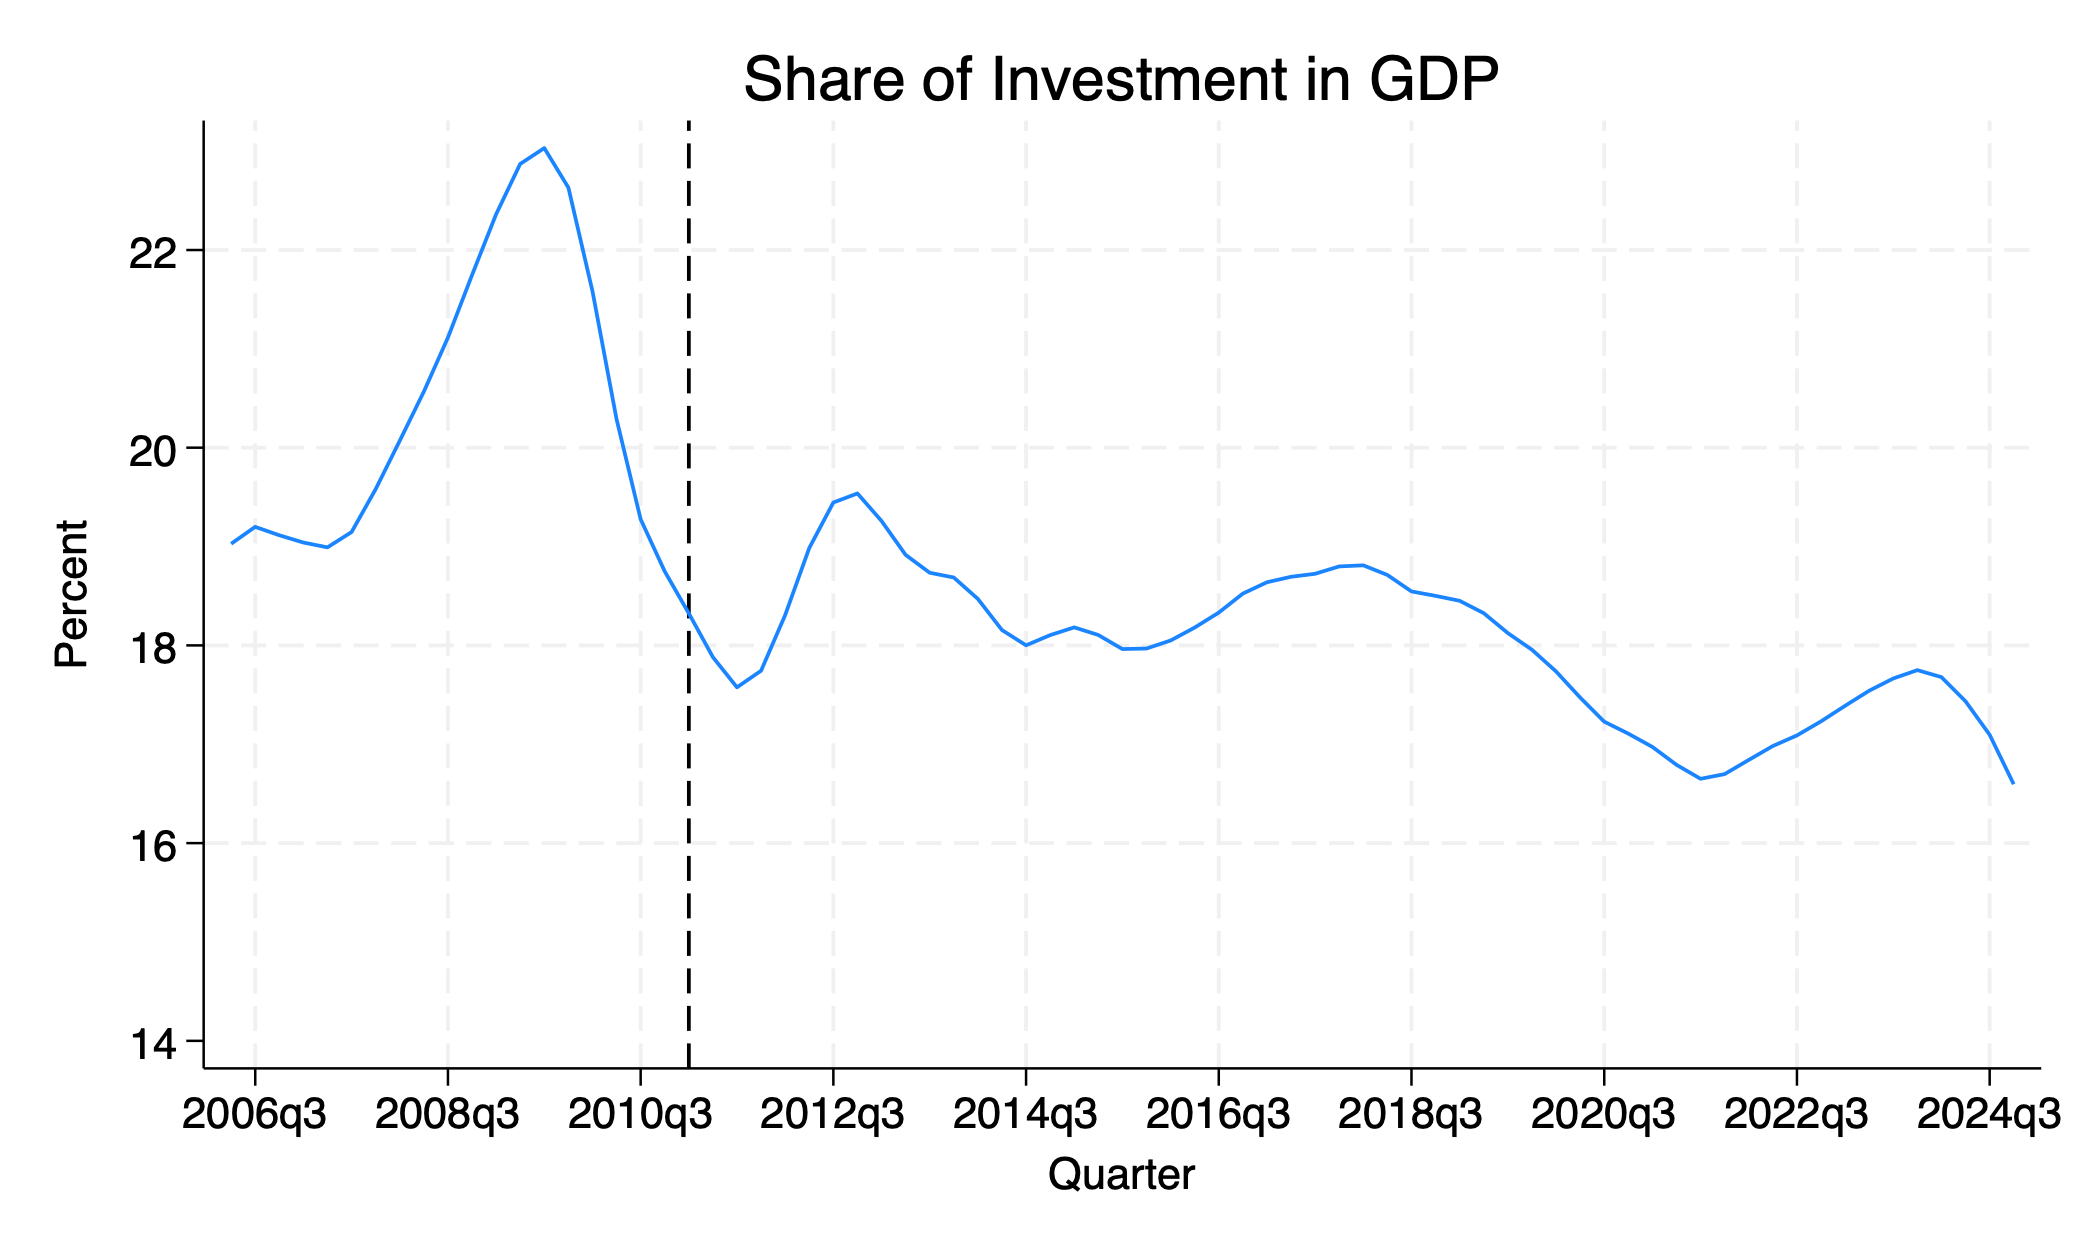
The two series do agree on one thing: the investment share has declined in recent years. But they diverge on its level — 14.8% in fall 2024 according to fixed prices, and roughly 2 percentage points higher using current prices. A more striking discrepancy lies in how each series reflects the response to sanctions. The fixed price series (Figure 1) shows the investment share rising after the imposition of sanctions—from around 14% to more than 18%. In contrast, the current price series (Figure 2) shows a decline over the same period.
I don’t have enough insight into how these figures are constructed to reconcile their diverging trends around 2011, but plausible explanations can found for both trends. The rise seen in Figure 1 could reflect a response to currency devaluation, which encouraged import substitution. Investment may have increased even as GDP (the denominator) declined. Conversely, the drop in Figure 2 could indicate a fall in investment as sanctions disrupted an ongoing investment boom tied to high oil prices—without necessarily causing a major drop in GDP.
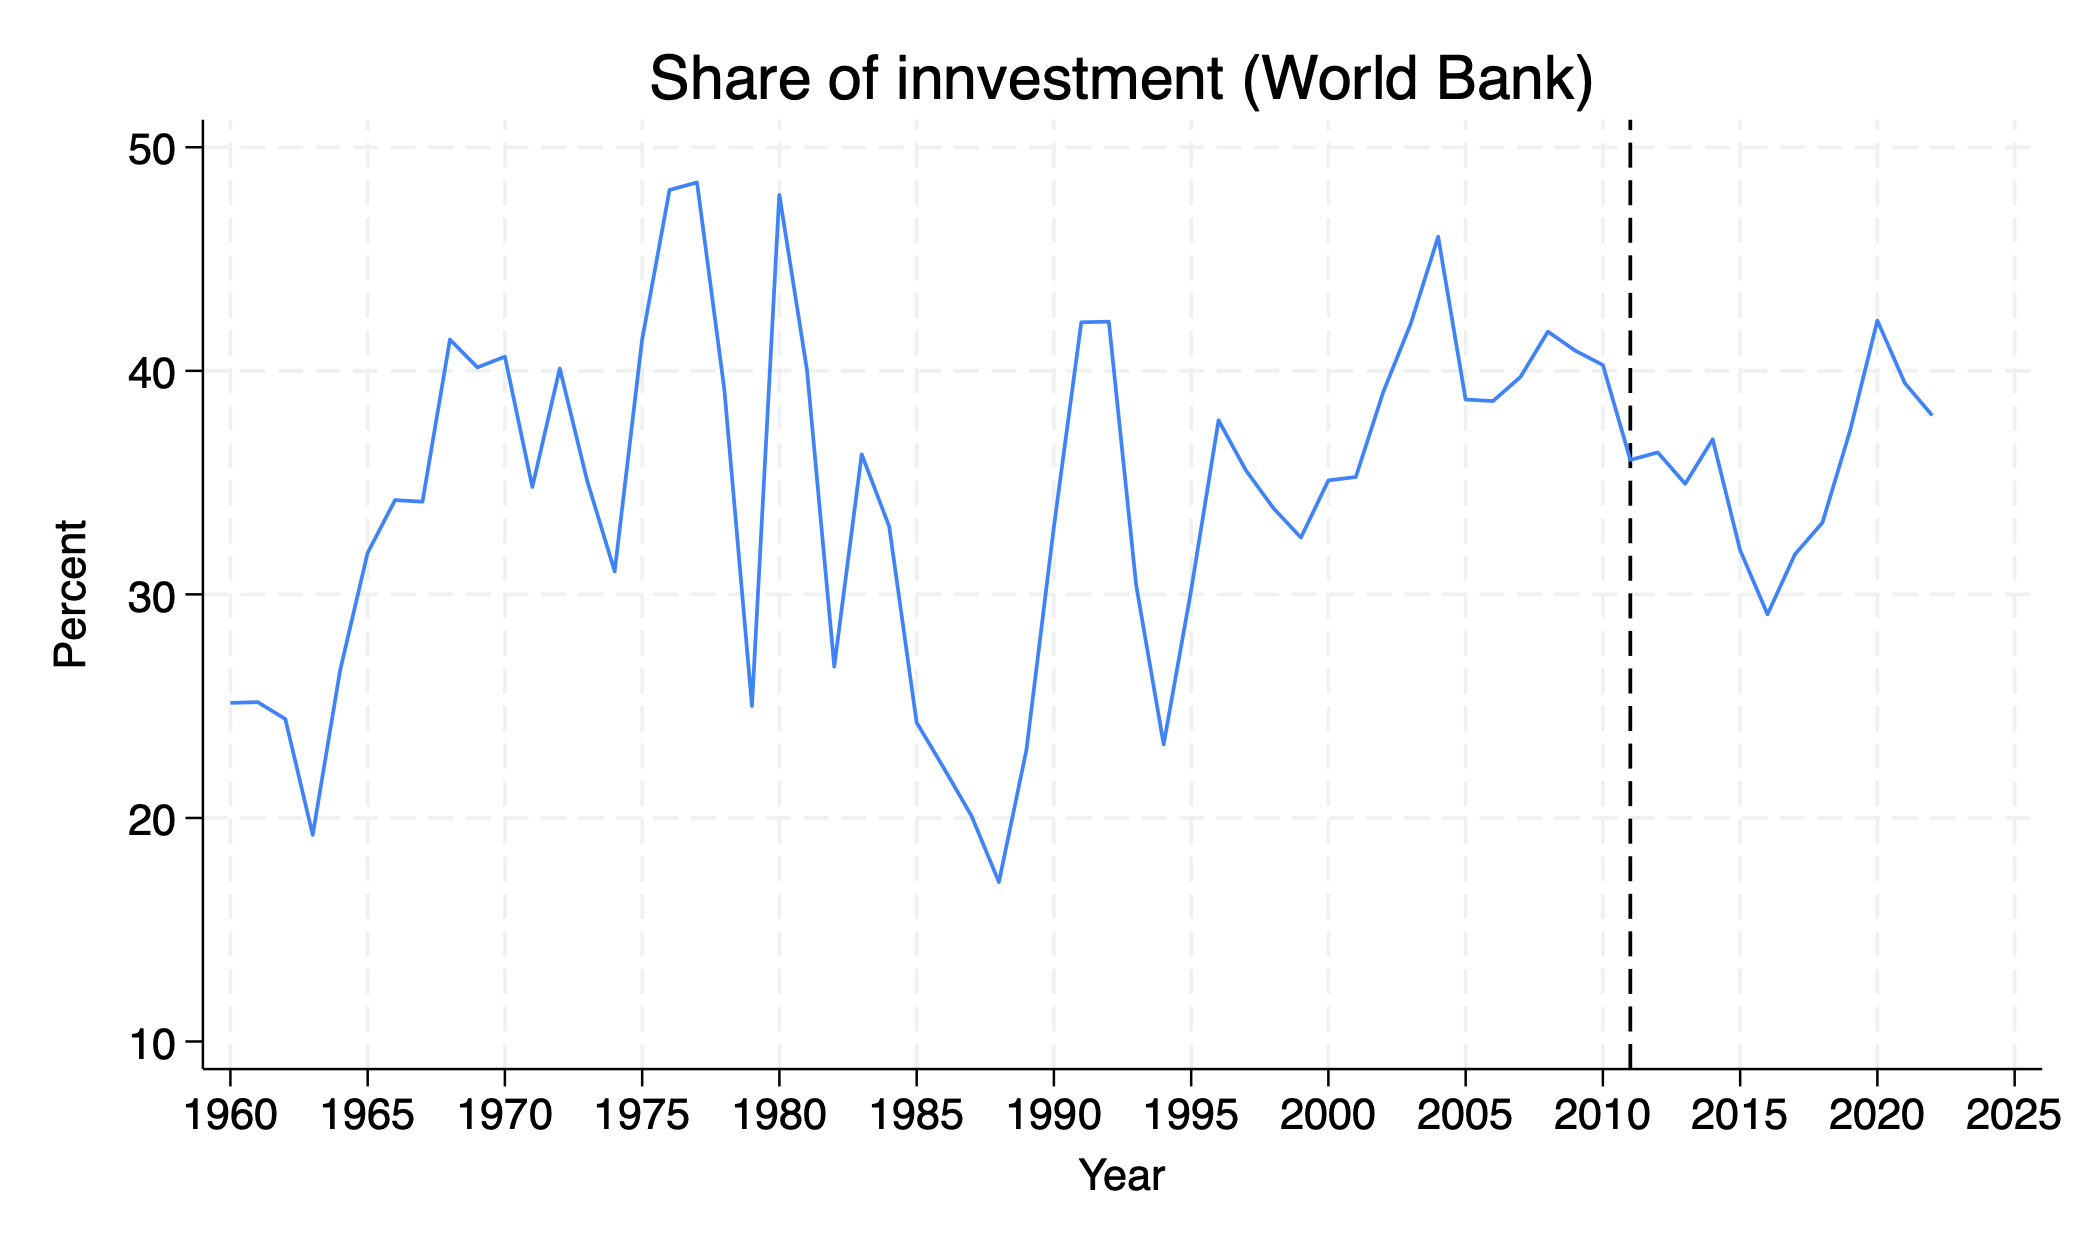
What complicates the picture further is that international sources report significantly higher investment shares. The Penn World Tables, for example, report gross capital formation (as a share of GDP at current PPPs) above 30% in 2019—compared to about 18% in the Iranian data (Figure 3). The World Bank’s World Development Indicators go even further, showing an investment share around 40% in 2022 (Figure 5). This seems hard to believe given the slump in construction and the ongoing neglect of oil and gas infrastructure.
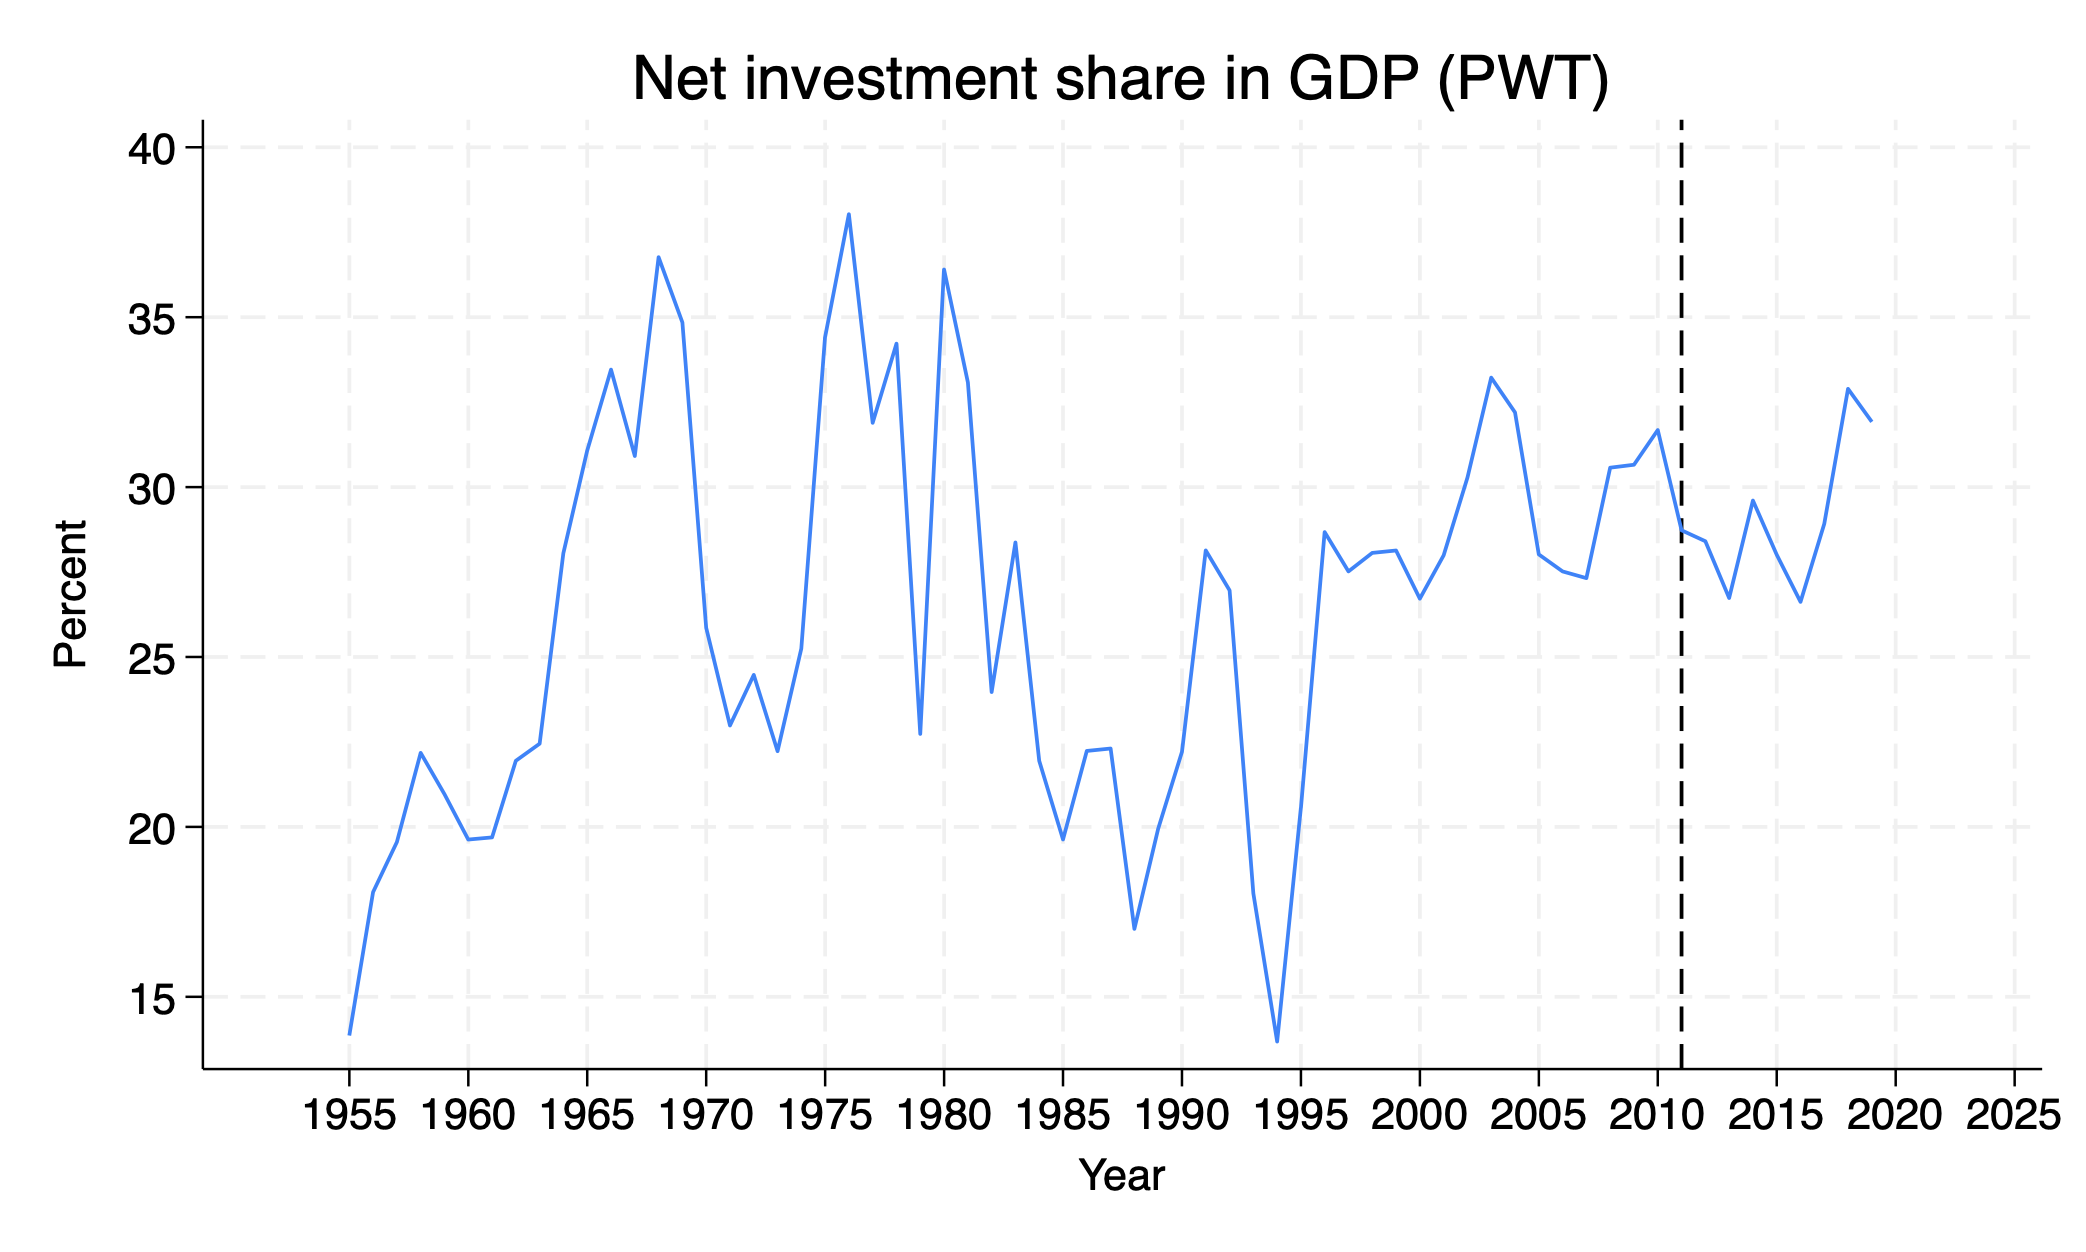
Equally surprising is the apparent increase in investment share after the start of Trump’s “maximum pressure” campaign in 2018. That said, both the Penn World Tables and World Development Indicators capture the sharp investment decline during the Iran-Iraq war in the late 1980s—a reminder that these sources are not entirely disconnected from domestic realities.
Still, the divergent trends across datasets—both domestic and international—highlight the challenges of relying on national accounts to assess economic fundamentals in Iran. These inconsistencies complicate efforts to interpret trends or design effective policy responses.
Yet, relying on Iran’s own official data, one conclusion is hard to avoid: despite reported improvements in living standards, Iran’s investment performance has been weak—too weak, perhaps, to sustain growth in the medium term.


[…] المخاطر التي تتكبدها البلاد. وسجل الاستثمار، الذي كان منخفضا بالفعل إلى الحد الذي جعله عاجزا عن التعويض عن انخفاض […]
Thank you for your insightful posts—I am a regular reader and consistently appreciate your perspective.
Given your expertise, I’d like your view on using SCI data for academic research, specifically for structural estimation with sub-provincial data. My main concern is data reliability and whether the preparation effort is worth it. I would greatly appreciate any insight you might have based on your experience.
Thanks for reading my blog. Iranian survey data are as good as they come for developing countries, certainly comparable with the Middle East surveys harmonized by the ERF. They are general surveys, which can be used creatively to answer more interesting questions than survey of consumption and employment, esp. their panel part.