More dire predictions of economic collapse in Iran from the Wall Street Journal
An angry and dystopian op-ed about Iran, published in the Wall Street Journal on March 1, committed several errors in judging Iran’s economic performance that would fail my undergraduates economic students. They are taught to never fall prey to the vagaries of exchange rate fluctuations in developing countries when making international comparisons of living standards. For example, if the value of a country’s currency drops suddenly, its GDP measured in US dollars doesn’t collapse immediately — it may even go up. Since the 1960s, millions of dollars has gone into research to make data available for international comparisons. These are widely available on the World Bank data bank site and from the Penn World Tables, where the International Comparison Project originated. I have previously written about international comparisons of living standards here and here in this blog and elsewhere. There is therefore no more excuse for picking bad data from the internet to write bad op-eds.
Kaplan may be excused for being wrong on Iran’s economy because, as a journalist, he does not have the economics training for this sort of thing. And being careful with facts and data will dull his sensational style of writing (more on this below). To his credit he did seek the counsel of a former World Bank official, who should know better, but then not everybody at the World Bank gets the training to work with GDP data.
Here is what Kaplan claims:
“In 1977 Iran’s economy was 26% larger than Turkey’s, 65% larger than South Korea’s, and almost 5.5 times the size of Vietnam’s—all countries with somewhat larger populations. In 2017 on the eve of the Trump administration’s sanctions, Turkey’s economy was nearly 2.5 times the size of Iran’s, South Korea’s more than seven times, and Vietnam’s had gone from less than 20% to 70%.”
And here are the numbers from the Penn World Tables, version 9.1, which use Purchasing Power Parity GDP values in millions USD (Comparable World Bank WDI data do not go back to 1977).
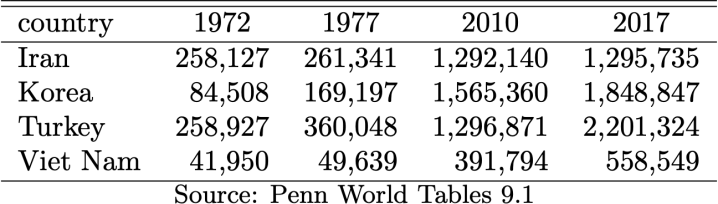
Kaplan is incorrect that in 1977 Iran’s GDP surpassed Turkey’s by 26%; it was actually lower by 27%. The oil boom, properly accounted for, had not increased Iran’s productive capacity by much in the previous 5 years, whereas Turkey’s had expanded by 39%, a tell-tale sign of deep problems with Iran’s model of economic growth in the 1970s. This is the model that many who miss the ancien regime wish would return. The other comparisons for 1977 are less biased.
The most misleading comparisons are for 2017. They are misleading for two reasons, because they use the wrong metric and because 2017 is six years after the US sanctions intensified. So, let’s first look at what the PPP-adjusted numbers say about 2017 GDP comparisons before we check how they stood in 2010, before sanctions intensified.
In 2017, Turkey’s economy was not 2.5 times that of Iran’s as Kaplan claims; larger it was, but by 70%. Furthermore, the 70% shortfall is not the result of 40 years of mismanagement in the Islamic Republic because before sanctions hit hard the GDP levels in the two countries were exactly equal. As I have shown here and here, since the mid 1990s, the two countries have been matching in terms of growth and GDP per capita (see also the graph below). During 1990-2010, before growth faltered under the weight of sanctions, Iran vastly outperformed Viet Nam, and its average growth rate for the period exceeded that of Turkey by 6 percentage points. The impressive growth spurt during these two decades does not mean good economic management — there was an oil boom in the second decade– but it does disprove the common assertion that Iran has been continuously falling behind its peers since the revolution. Could Iran have done better under the Shah? Perhaps. Who knows what could have happened had he not mismanaged the oil boom and kept his police state in check.

Kaplan goes on to push his usual doomsday scenario for Iran, warning of a Soviet-style collapse with ensuing chaos across Iran and the region. Iran’s economy is not in a good place by any measure, especially with the corona virus roaming the country unchecked, but before you are too alarmed with Kaplan’s predictions, you should read his much more influential dystopian vision of where Sierra Leone and the whole of West Africa was heading in the 1990s, published in the Atlantic in 1994. I remember reading it at the time and thinking how different it was from the impression I had of Sierra Leone, having worked on the country in the 1980s, before it descended into chaos and civil war in the 1990s. Kaplan attributed the social and political collapse of Sierra Leone to population pressure, and went on to warn that, “West Africa is becoming the symbol of worldwide demographic, environmental, and societal stress, in which criminal anarchy emerges as the real “strategic” danger… West Africa provides an appropriate introduction to the issues, often extremely unpleasant to discuss, that will soon confront our civilization.”
Think how off he was in 1994 about the nature of the threats that “our civilization” faces today, and where these threats come from (overpopulation?). His crude take on developing societies that he barely knows blinds him the to possibility that, had the nuclear deal stayed on and the Trump sanctions not hurt Iran’s economy in 2018, the country might well have returned to the modest growth path it was on for two decades during 1991-2010.


Thanks for the enlightening post. It is alarming how media outlets are behaving.