Does economic growth in Iran increase income inequality?
Inclusive growth is what international organizations recommend these days, and it hard to argue otherwise. Economic growth is better when rich and poor equally benefit. Better still, is pro-poor growth, the type that lifts poor people’s incomes more than the rest. The recent unrest in Iranian cities makes this question timely: was Iran’s recent economic growth following the implementation of the nuclear deal unequal, inclusive, or pro-poor? Clearly, low-income youth who staged the protests believe that growth has not been inclusive. Can data verify their sentiments? It turns out they do. More specifically, the economic growth of 2016, which is the main fruit of Rouhani’s international and domestic policies, does not seem to have reached all social classes equally.
The economic growth in question is the rapid recovery after the nuclear deal went into effect, in January 2016.. According to the Statistical Center of Iran (SCI), GDP increased by 10.8% during 21 March 2016 to 20 March 2017 (Iranian year 1395). The non-oil GDP, which measures more closely the level of economic activity than GDP with oil, grew more slowly but still a robust rate ( (6.2%). (The Central Bank figures are different but are in the same direction: 12.5 percent growth for GDP and only 3.3 percent for non-oil GDP). Despite flat oil exports, non-oil GDP has continued to grow at 6.0 percent per year for the first half of 1396, to 20 September 2017, the latest period for which SCI provides the data.
The questions is, then, whether this growth is visible in the expenditures of ordinary Iranians, and how it breaks down by income group. A neat little graphic tool called growth incidence curves (GIC), will help us answer these questions. The GICs I show here plot the growth rate of per capita expenditures (pce) by quintiles of pce. (For a more information on GICs, see Ferreira et al). They offer a simple visual regarding the inclusivity of economic growth. If the curve is downward sloping, the pce of poor deciles has grown faster than the rich, and growth has been pro-poor; the opposite if upward sloping.
Let us begin by the GIC for the year of economic recovery. The graph below shows changes in the living standard (measured by real pce) during 1394-1395 (2016/17-2015/16) by decile of pce. Notice that for the most part the graph is upward sloping. Richer deciles experienced faster growth than the poor. The red line in the middle is the growth of the median pce, about 1.3 percent. The real pce of the top two deciles grew twice as fast as the median, while all deciles below the median grew by less than one parent. The second poorest decile actually lost ground while the country as a whole growing.
Clearly, growth was unequal and not inclusive (one decile lost pce). This is not surprising given the source of this growth, and all post-revolution growth spells — higher oil revenues. Oil-induced growth tends to be unequally distributed because oil revenues do not accrue to individuals, as would the proceeds of some mass produced export that employed a cross section of workers. They go instead directly to the government coffers and only later find their way, through opaque channels, down the economic ladder. The main channels are government contracts, credit subsidy, government transfers, and higher government salaries. From here suppliers of goods and services to the government and others who were first in line to receive something from the government, begin to see the benefits of the economic expansion.
Figure 1. Unequal recovery

Note: Per capita expenditures are deflated using the Central Bank of Iran consumer price index. The deciles are defined by the weighted distribution of individual expenditures. GICs are produced using stata’s gicurve.
During the first three years of Rouhani the economy contracted, and the contraction was also unequalizing. As Figure 2 shows, during 2013-2015, the only group not to lose in terms of real pce was the top decile.
Figure 2. Growth incidence during Rouhani’s first three years

What these graphs suggest is that, left to itself Iran’s economic system does not treat people at the bottom of the economic ladder as well as those at the top. In particular, the system does not seem to distribute rising windfalls from oil equally. I have found evidence for rising inequality during oil booms in my previous research (here and here).
Has this always been the case with oil booms? Going back to the first, though very brief, positive oil shock after the Islamic Republic had established itself, we find growth to be unequalizing. During 1990-1991, when the first Persian Gulf war briefly lifted oil prices, we notice an upward sloping GIC (Figure 3, left panel). A 4.3 percent average growth in pce was distributed unevenly, drawing criticism for President Rafsanjani economic policies. The pattern for the rest of Rafsanjani’s time in office was a bit different but still unequalizing (Figure 3, right panel). The very bottom decile experienced a slightly higher-than-the-median growth, while the top decile did the best.


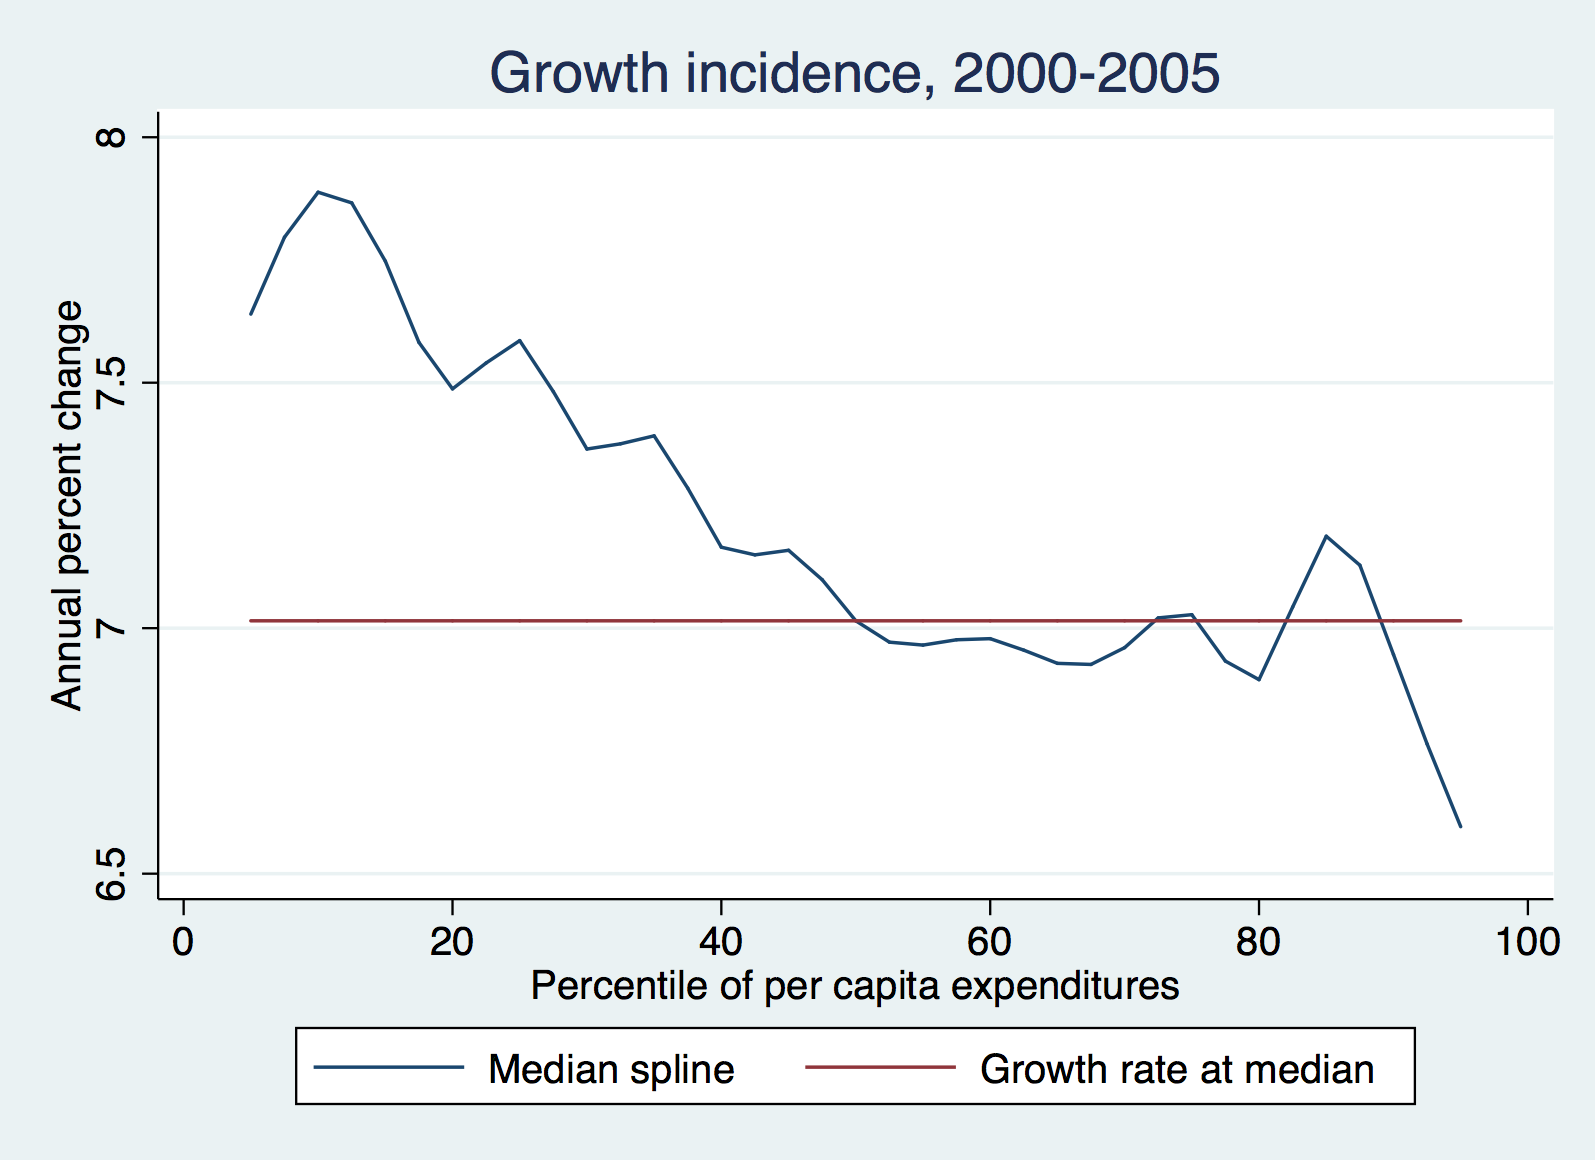
What about the oil boom of the early 2000s, during the second Khatami administration? Was it, too, unequalizing? Significantly, for the period 2000-2005 we get a downward sloping GIC (Figure 4), indicating pro-poor growth. During this period, the median real pce grew by more than 7 percent per year, with the poorest decile doing even better. Does this negate the pattern of unequalizing growth observed in other oil booms? The answer is no. If we limit the analysis to the sub-period when oil revenues grew fastest, 2003-2005, the GIC is again upward sloping (Figure 4, right panel). An even faster median growth was distributed unequally between the bottom and top deciles of pce. I do not know of any change in policy that could explain this reversal, so I tend to think that oil may be the reason.

Finally, if you are not already tired of these graphs, you may ask if oil-induced growth was more inclusive under the populist President Mahmoud Ahmadinejad. The answer is yes and no. The first year of office, the GIC was still upward sloping (Figure 5, left panel), indicating unequal growth. But later on, once the oil boom had worked its way through the system and Ahmadinejad’s populist programs had kicked in, the GIC became downward slowing (Figure 5, right panel), and growth was once again pro-poor.

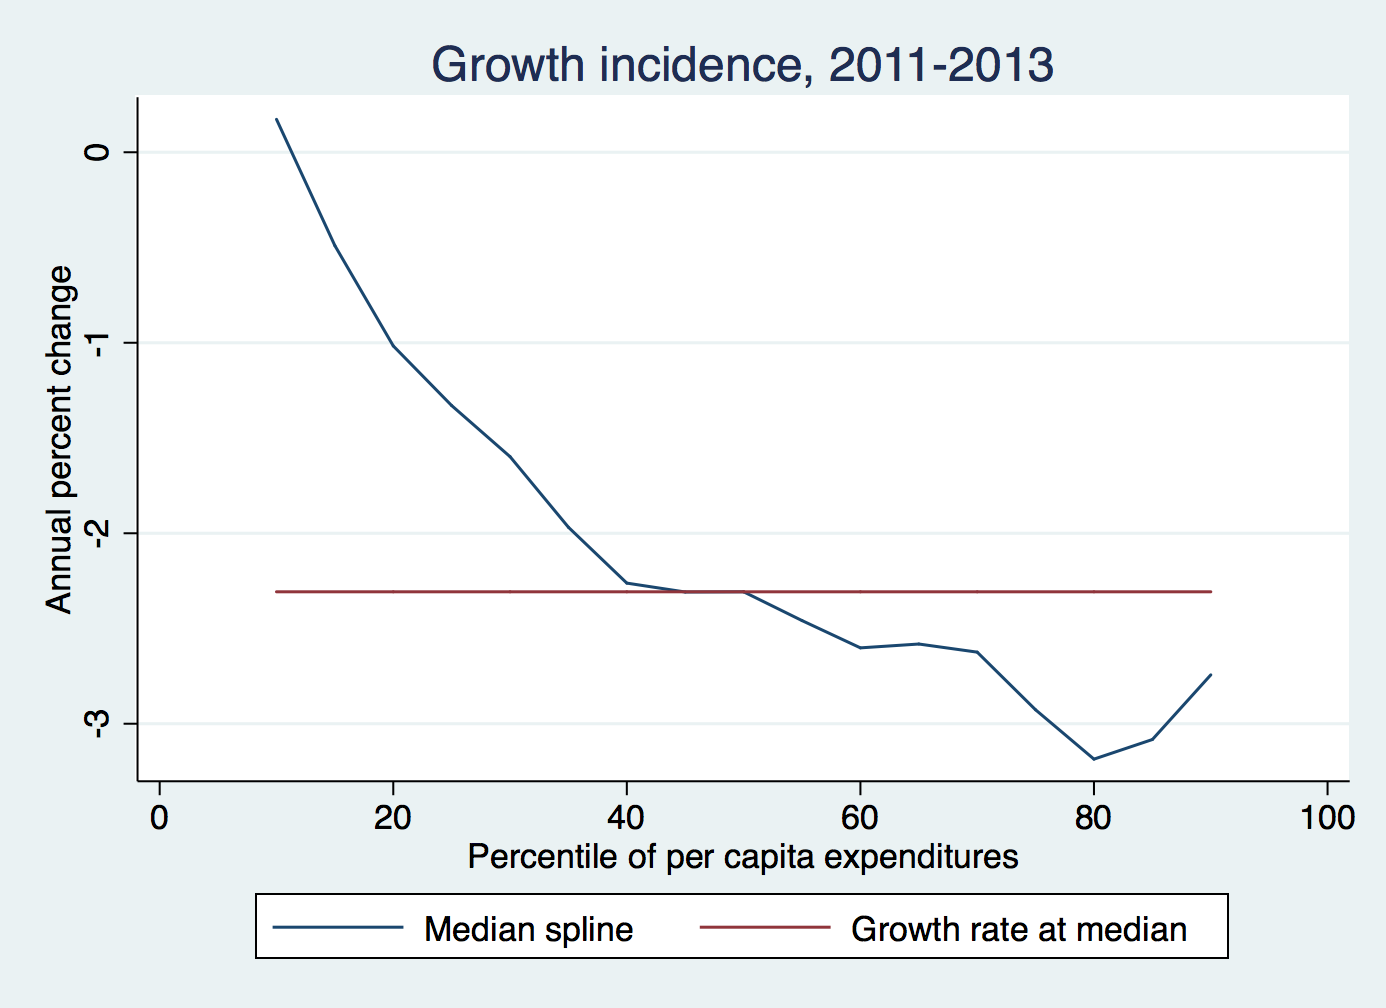
As the economy entered into negative growth — the sanctions induced recession — the GIC remained downward sloping. I believe the cash transfer program that Ahmadinejad started in 2011 was most effective in protecting the poor during the downturn that covered the remainder of his term, 2011-2013. The recession brought the median pce by 2.4 percent per year, and reduced pce for all deciles except the very poorest.
Figure 6. Cash transfers and inequality
Lest these observations are taken to mean that redistribution trumps growth, let me add a quick note. Without economic growth, long-term improvement in the lot of the poor, which can only come from more and better jobs, is not possible. Redistribution has its limits; in particular, it can reduce growth.


Dear Dr. Djavad,,
First of all, i want to thank you so much for your useful website, analysis about Iran’s economy, it helps me in my economic researching field specially about Iran. secondly, I need a list of useful Pages,or websites which concern about analyzing Iran’s Economy.
Best Regards,,
Ahmed Shamseldien
Economic Researcher
Dr. Salehi. One year statistics, your first chart, is simply too short for a meaningful deduction and therefore is not useful to show the effects of JCPOA on income distribution. It appears that the graphs basically depict the movements in oil income and how different administrations have used that income to subsidize the poor. Rouhani has cut back on these cash transfers( yaranehs), thereby increasing short term inequality, and as you demonstrated in an earlier paper, affecting the rural areas and small towns disproportionately. In my opinion the roots of the recent uprising are complex, may not be merely explained by short term macroeconomic data, and, are cumulations of many years of grievances- economic, social and political. JCPOA may simply be the straw that broke the camel’s back.
Thanks for your thoughtful comment. I did not mean to “explain” the unrest, which I think is very hard to do. The question was prompted by the protests, though, as I mentioned at the top. Having said that, these data are saying something about the nature of economic recovery and the dissatisfaction it may have caused.
Sent from my iPad